Canadian Occupational Projection System (COPS)
Macroeconomic Outlook (2022-2031)
|
NOTE: The current macroeconomic projections were completed in spring 2022, i.e. before expectations about the risk of an eventual recession in 2023. However, the focus of the COPS projections is on long-term trends in industrial and occupational labour markets, not on short-term developments. These long-term trends are not expected to be affected markedly by an eventual recession as its impacts are expected to be temporary and of short duration. The occupational projections prepared under the Canadian Occupational Projection System (COPS) require the production of a macroeconomic outlook to determine the future long-term trends in overall employment growth and in the distribution of employment across industries and occupations. This document presents the macroeconomic outlook that underlies the 2022 COPS projections. This outlook was developed in collaboration with the Deloitte based on information available as of Spring 2022. The future long-term trends in Canada’s economic growth will be heavily influenced by demographic developments, namely population aging and higher immigration. Such demographic changes are projected to have a significant influence in the long-term evolution of Canada's labour force, employment, and economic potential. |
Demographics, Labour Force, and Potential GDP
Figure 1 presents growth in the Canadian population of working age over the period 1982-1991, 1992-2001, 2002-2011, 2012-2021 and 2022-2031. It shows that growth in Canada’s population of working age is projected to strengthen over the period 2022-2031, stimulated by immigration.
Figure 1: Growth in Canadian Population of Working Age (average annual growth, in percentage)
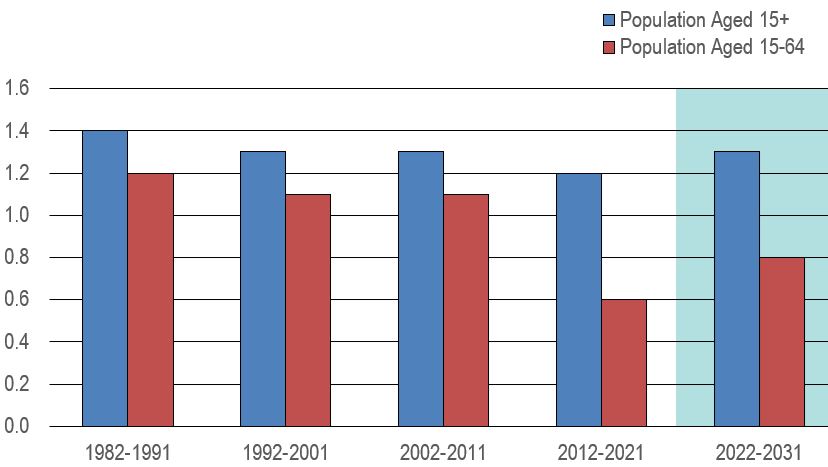
Source: Statistics Canada (historical data and projections). The shaded area represents projections.
Text version of Figure 1: Growth in Canadian Population of Working Age
Growth in population aged 15+ is projected to average 1.3% annually over the period 2022-2031, up from 1.2% from 2012 to 2021 and similar to the pace of growth recorded over the periods 2002-2011 and 1992-2001.
This slight acceleration relative to the previous decade reflects a significant increase in immigration target announced by the federal government as well as the anticipated improvement in life expectancy. Those developments will partly offset the slight decline projected in the natural increase of the population (births minus deaths) attributable to a low fertility rate and a rise in deaths due to population aging.
Increased immigration is also projected to accelerate the pace of growth in the 15-64 age group to 0.8% annually, up from 0.6% in the previous decade. However, it will remain lower than the 1.1% growth recorded over the periods 2002-2011 and 1992-2001 due to the aging of the baby-boomers (born between 1946 and 1965).
Indeed, as baby-boomers represent Canada’s largest generation in history, their gradual transition into the 65+ age group will continue to restrain population growth in the 15-64 age group (baby boomers started turning 65 in 2011).
Figure 2 presents the source of population growth in Canada, that is natural increase (births minus deaths) and immigration, over the historical period of 1977 to 2021 and the projection period of 2022-2031
Figure 2: Components of Population Growth
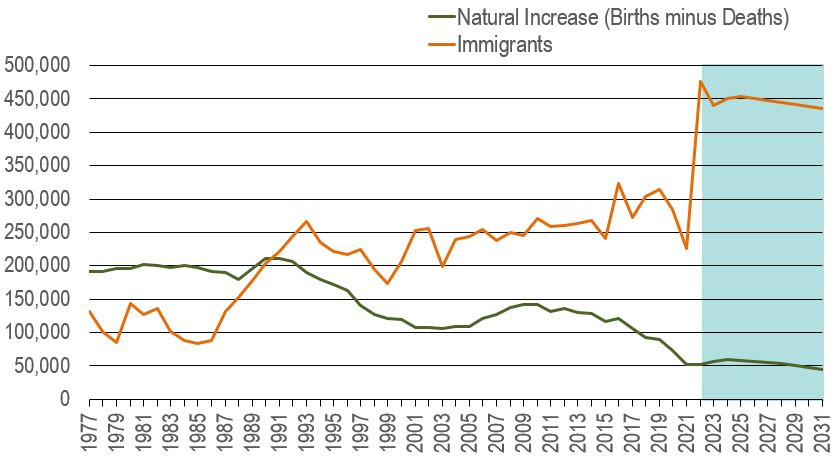
Source: Statistics Canada (historical data and projections). The shaded area represents projections.
Text version of Figure 2: Components of Population Growth
In early 2022, the federal government announced a significant increase in its immigration target to “ensure Canada has the workers it needs to fill critical labour market gaps and support a strong economy into the future”. Under this new plan, the number of new immigrants admitted annually in Canada will outpace the average of the past decade by almost 200,000.
As a result of a relatively low fertility rate and a rise in deaths due to population aging, the natural increase of the population (births minus deaths) is expected to continue to decline over the next decade, but at a slower pace than the previous decade. This slowdown essentially reflects the positive impact of increased immigration on births and a return in the number of deaths to more normal levels after a surge during the COVID-19 pandemic.
The declining trend projected in the natural increase of the population will result in immigration accounting for a rising share of Canada’s population growth.
Figure 3 presents the percentage distribution of the working-age population by age group in 1981, 1991, 2001, 2011, 2021 and 2031. It shows that, despite this, people aged 65 and over will account for an increasing share of the working age population.
Figure 3: Distribution of the Working-Age Population by Age Group (in percentage of population aged 15+)
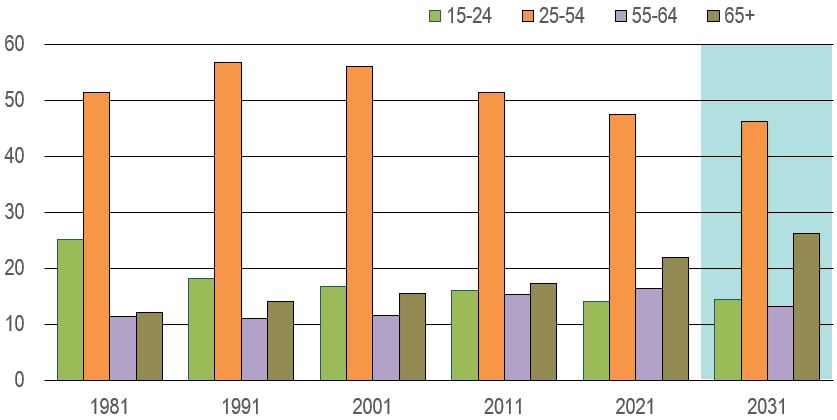
Source: Statistics Canada (historical data and projections). The shaded area represents projections.
Text version of Figure 3: Distribution of the Working-Age Population by Age Group
More baby-boomers will be entering in the 65+ age group over the projection period, boosting population growth in the older age group relative to the younger age groups.
As a result, the 65+ age group will account for an increasing share of the working age population. By 2031, those aged 65+ are projected to represent 26% of the working age population, up from 22% in 2021 and 17% in 2011. In comparison, those aged 55 to 64 are projected to account for 13% of the working age population in 2031.
This means that 39% of the labour force source population will be aged 55 and over by 2031, compared to 38% in 2021 and 33% in 2011.
Figure 4 presents the labour force participation rates by age group from 1977 to 2031.Labour force participation rates are projected to increase marginally in most age groups.
Figure 4: Labour Force Participation Rates by Age Group (in percentage)
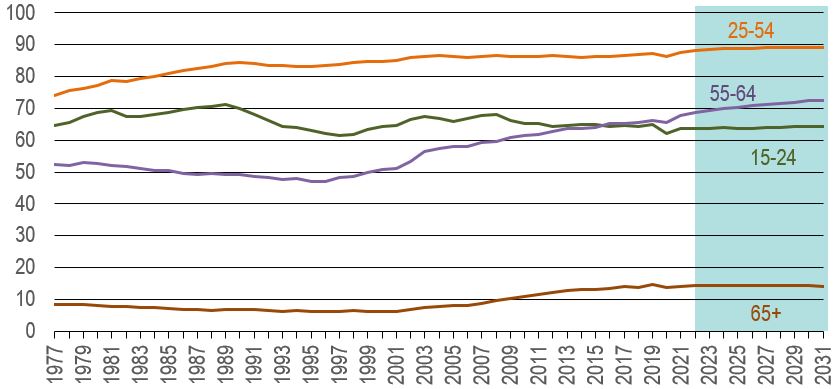
Sources: Statistics Canada (historical) and ESDC 2022 COPS macroeconomic outlook. The shaded area represents projections.
Text version of Figure 4: Labour Force Participation Rates by Age Group
Participation rates are projected to edge up in most age groups over the period 2022-2031, with the largest increase among the 55-64 years old.
Labour market attachment is also projected to increase among those aged 25-54, albeit to a lesser extent than their older counterparts, partly reflecting a leveling out of women’s participation rate in the prime age group and slower growth in the average level of education.
After being negatively affected by the COVID-19 pandemic, more so than any other age groups, the participation rate among the 15-24 years old straightened in 2021, reflecting more favourable labour market conditions for youths as the sectors that were severely impacted by the pandemic, and employing a high concentration of youths, gradually reopened with the lifting of public health measures. The participation rate in this age group is projected to increase somewhat over the next decade, but labour market attachment among youths remains constrained by a number of factors, including the rising trend in post-secondary school enrollment and the leveling off in the share of students in the labour force.
In the older age group of 55-64, the participation rate is expected to continue to increase as new cohorts tend to retire at a later age than previous cohorts, partly because they are more educated and in better health. The pace of increase in their participation rate is, however, projected to slow with the gradual fading of intergenerational differences.
Among those aged 65+, the growing share of older individuals (75+) is expected to lower labour market attachment somewhat by the end of the projection period, with the participation rate returning to the same level as 2021.
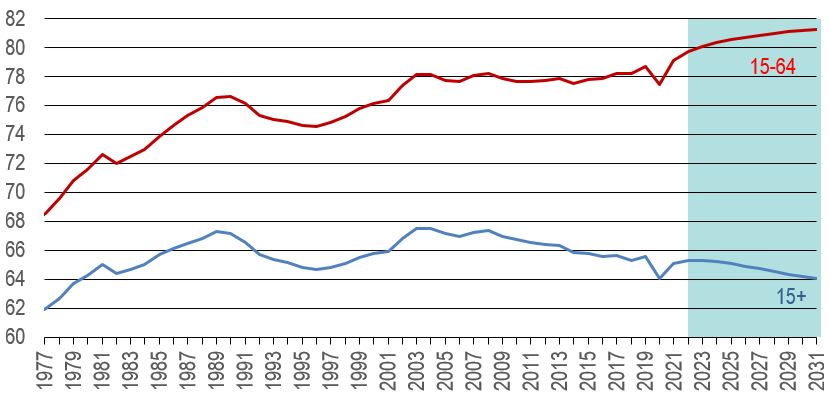
Figure 5 presents the labour force participation rates of people aged 15 and over as well as of those aged 15 to 64, from 1977 to 2031. It shows that despite the marginal increases projected in the participation rate among most age groups, the lower labour force attachment of older individuals will continue to pull down the overall labour force participation rate (15+).
Figure 5: Overall Labour Force Participation Rate (15+ and 15-64) (in percentage)
Sources: Statistics Canada (historical) and ESDC 2022 COPS macroeconomic outlook. The shaded area represents projections.
Text version of Figure 5: Overall Labour Force Participation Rate (15+ and 15-64)
Despite the projected increases in the participation rate among most age groups, the overall participation rate of the population aged 15 and over is expected to keep declining during the period 2022-2031 as a result of population aging.
Indeed, the shift in the age composition of the working age population towards the lower attachment group of 65+ is projected to push further down the overall participation rate by 1.0 percentage point, from 65.1% in 2021 to 64.1% in 2031 (the proportion of people with low participation rates will continue to increase, while the proportion of people with high participation rates will continue to decrease, lowering the average participation rate further in the working age population of 15+).
In contrast, the participation rate for those aged 15-64 is expected to keep increasing over the projection period, up by 2.2 percentage points, from 79.1% in 2021 (already an all-time high at that point) to 81.3% in 2031.
The participation rate for those aged 65+ is projected to stagnate and remain much lower than the rate observed for the younger age groups, standing at 14.0% in both 2021 and 2031 (see previous chart).
Figure 6 presents the levels and the pace of growth in total labour force from 1978 to 2031. It shows that by increasing the working age population, higher immigration will help to support labour force growth.
Figure 6: Total Labour Force
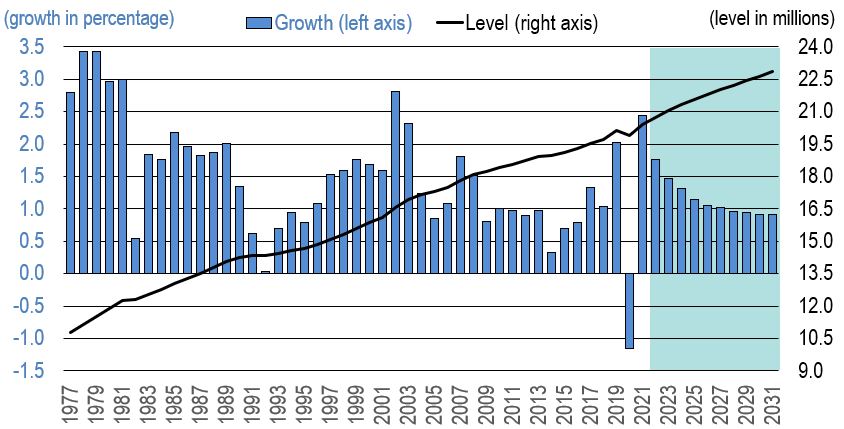
The total number of people in the labour force is the product of the working-age population and the overall participation rate:
(Labour Force 15+ = Population 15+ x Participation Rate 15+)
Sources: Statistics Canada (historical) and ESDC 2022 COPS macroeconomic outlook. The shaded area represents projections.
Text version of Figure 6: Total Labour Force
The total number of people in the labour force is the product of the working age population and the overall participation rate (Labour Force 15+ = Population 15+ x Participation Rate of those aged 15+)
Increased immigration is expected to accelerate the pace of growth in the population of working age (see page 5) and help support labour force growth over the short- to medium-term. However, population aging and the associated decline in the overall participation rate will continue to restrain labour force growth in the longer term.
Indeed, while the number of people entering the labour market will continue to exceed the number of people leaving the labour force, the gap is expected to narrow gradually over the projection period, largely due to the additional number of baby-boomers who will retire from the labour market.
The resulting pace of growth in the labour force is expected to average 1.2% annually over the period 2022-2031, up from 0.9% over the period 2012-2021. This significant acceleration in labour force growth essentially reflects two factors:
- The COVID-19 pandemic led to a large decline in the labour force in 2020, lowering its average growth rate for the whole period 2012-2021.
- By boosting the population of working age, increased immigration is expected to support growth in the labour force over the period 2022-2031 and become the sole contributor to Canada’s labour force growth by 2026.
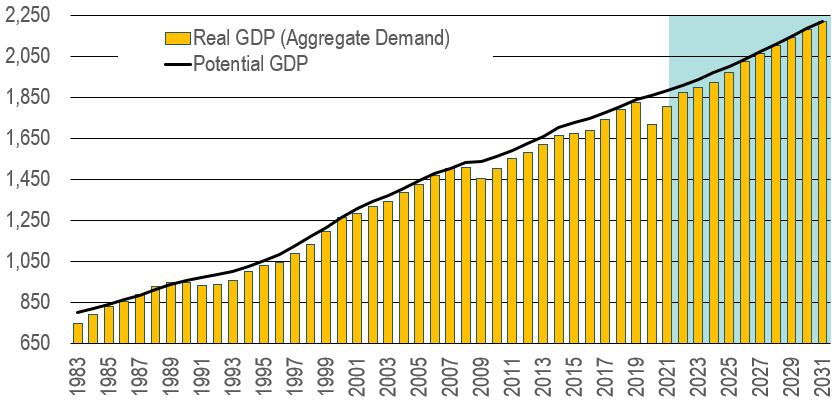
Figure 7 presents the evolution of real and potential GDP from 1983 to 2031. In the projection, aggregate demand moves in line with potential output over the medium-term.
Figure 7: Real and Potential GDP (in billions of chained 2012 dollars)
Source: Statistics Canada (historical) and ESDC 2022 COPS macroeconomic outlook. The shaded area represents projections.
Text version of Figure 7: Real and Potential GDP
In the long-term, aggregate demand is determined by potential GDP, which is the level of activity the economy can reach when all factors of production are fully and efficiently utilized. Potential output is a function of the size of the labour force, the level of fixed capital, and total factor productivity.
Over the period 2003-2007, growth in aggregate demand outpaced growth in potential output, creating some pressures in the labour market and lowering the unemployment rate significantly. Thereafter, the economy went into recession and aggregate demand fell below potential output, leading to a negative output gap.
The economic recovery that followed the recession of 2008-2009 led to a gradual closure of the output gap over the period 2010-2019, with the exception of 2015-2016 when growth in aggregate demand weakened as a result of major investment cutbacks from the energy sector due to the sharp decline in crude oil prices.
In 2020, the COVID-19 pandemic led to an unprecedented decline in output and the largest negative output gap ever recorded. Growth in aggregate demand is expected to exceed growth in potential output during the first half of the projection period, allowing the Canadian economy to fully close the output gap and return to potential GDP by the end of the projection period.
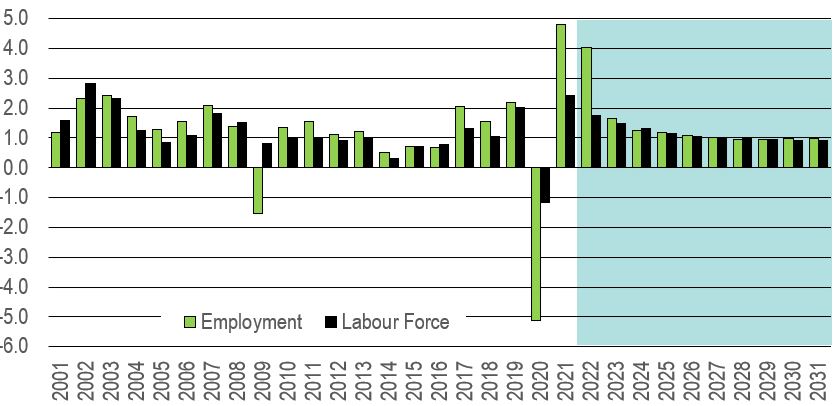
Figure 8 presents the pace of growth in employment and in the labour force from 2001 to 2031. It shows that as aggregate demand moves in line with potential output over the medium-term, this will allow employment to increase in line with labour force growth and the unemployment rate to remain low.
Figure 8: Growth in Employment and Labour Force (in percentage)
Sources: Statistics Canada (historical) and ESDC 2022 COPS macroeconomic outlook. The shaded area represents projections.
Text version of Figure 8: Growth in Employment and Labour Force
In 2020, employment and the labour force fell at an unprecedented pace as the federal and provincial governments put in place a series of restrictive health measures to contain the propagation of the COVID-19 virus. Massive job losses led to a substantial jump in the unemployment rate, up from an historical low of 5.7% in 2019 to 9.6% in 2020.
With the gradual lifting of public health measures, employment and the labour force rebounded by 4.8% and 2.4% respectivey in 2021. As gains in employment largely exceeded the increase in the labour force, the unemployment rate fell back to an average of 7.4% during that year. Labour market conditions continued to improve in early 2022, lowering the unemployment rate to its lowest level on record and resulting in a very tight labour market.
With an unemployment rate currently sitting at what would be considered as its natural or full employment rate, employment growth will be essentially constrained by growth in the labour force starting in 2023. Massive retirements of baby-boomers from the labour market will continue to generate job vacancies, which will facilitate job search for any new unemployed individual, contributing to maintain the unemployment rate low.
The resulting pace of growth in employment is expected to average 1.4% annually over the period 2022-2031, up from 0.9% over the period 2012-2021. This significant acceleration in employment growth essentially reflects two factors:
- The COVID-19 pandemic led to a large decline in employment in 2020, lowering its average growth rate for the whole period 2012-2021.
- The strong pace of growth projected in employment for 2022 (+4.0%) tends to boost the annual average growth rate for the whole period 2022-2031. In fact, employment growth falls to an average of 1.1% annually over the projection period when excluding year 2022, which is more in line with growth in the labour force.
External and Domestic Drivers of Aggregate Demand
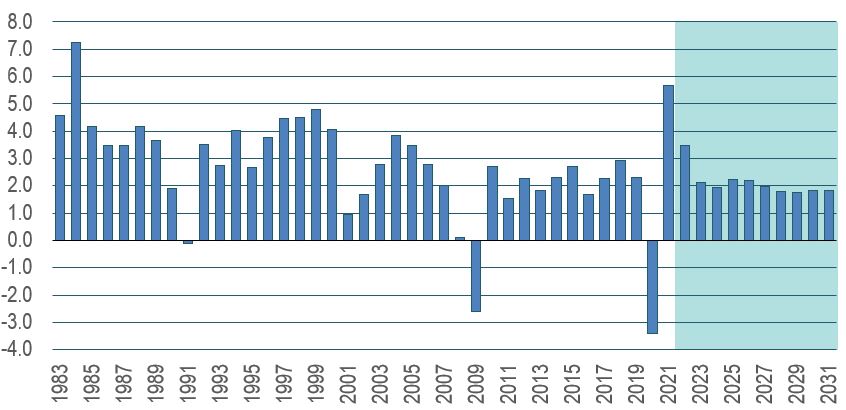
Figure 9 presents the pace of growth in U.S. real GDP from 1983 to 2031. It shows that the U.S. outlook remains strong for 2022, but economic and demographic factors are expected to restrain real GDP growth starting in 2023.
Figure 9: Real GDP Growth in the United States (in percentage)
Sources: Statistics Canada (historical) and ESDC 2022 COPS macroeconomic outlook. The shaded area represents projections.
Text version of Figure 9: U.S. Real GDP Growth in the United States
After falling substantially in 2020 as a result of the COVID-19 lockdown, real GDP in the United States fully recovered in 2021 and is expected to grow by a further 3.5% in 2022, driven by additional gains in consumer spending (+3.2%), business investment (+3.6%) and exports (+5.0%). Demand for services is estimated to see strong gains as consumers redirect some of their spending away from goods which reached unprecedented levels during the pandemic.
Starting in 2023, the U.S. economy is expected to grow at a slower pace of around 2.0% annually. This slowdown primarily reflects weaker increases in consumer spending in the short- to medium-term (due to rising interest rates and reduced purchasing power resulting from higher inflation) and the impacts of demographic changes on domestic demand and potential output in the longer term.
Indeed, growth in the labour force will gradually weaken due to slower growth in the working age population and downward pressure on the participation rate, limiting the U.S. economy’s ability to grow (the United States have less immigration as a share of the population compared to Canada). In early 2022, the unemployment rate was already standing at 3.5%, its lowest level since the 1960s. Massive retirements of baby-boomers from the labour market will continue to generate job vacancies and absorb a significant number of unemployed people, contributing to maintain the unemployment rate low.
Aside from the direct impact on labour supply, slower growth in the population of working age will have two notable impacts on capital investment. First, it will keep labour markets tight, incentivizing capital investment in productivity enhancing machinery and equipment. But more importantly, it will necessarily affect the demand for good and services and reduce the pace of growth in consumer spending and housing, lowering the need for additional capital investment from businesses. Overall, weaker growth in labour supply and capital investment will dampen potential output despite the faster pace of growth anticipated in productivity.
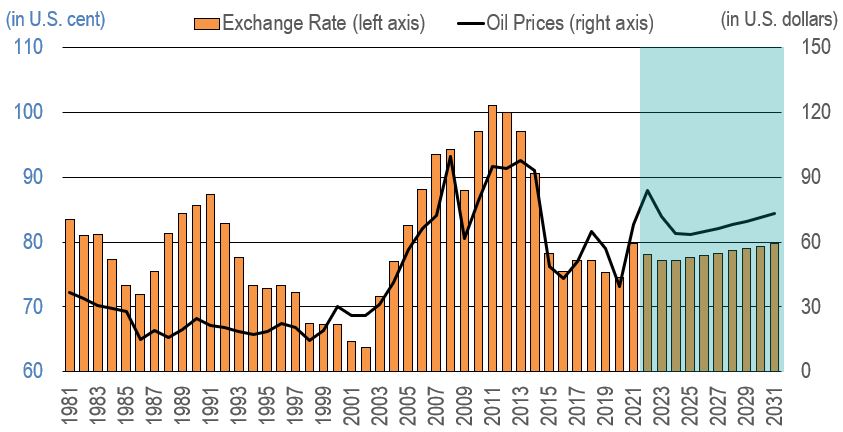
Figure 10 presents the evolution of the Canada-U.S. exchange rate and world oil prices from 1981 to 2031. It shows that the value of the Canadian dollar relative to the U.S. dollar is expected to decline in the near term, before recovering gradually over the longer term.
Figure 10: Canada-U.S. Exchange Rate and World Oil Prices (in U.S. cent)
Sources: Statistics Canada (historical) and ESDC 2022 COPS macroeconomic outlook. The shaded area represents projections.
Text version of Figure 10: Canada-U.S. Exchange Rate and World Oil Prices
Since the early 2000s, the movement in the value of the Canadian dollar against the U.S. dollar largely reflected fluctuations in world prices for commodities, particularly oil prices. The rapid decline in world oil prices in 2014-2015 has resulted in a steep depreciation of the Canadian dollar relative to the U.S. dollar. Oil prices reached a bottom in 2016 and partly recovered in the following two-to-three years, but excess supply continued to constrain prices.
With demand plummeting at the onset of the COVID-19 pandemic, oil prices fell back in 2020, but quickly recovered in 2021, along with most commodity prices, as consumer demand rotated from services to goods during lockdowns (higher demand for goods, combined with global supply disruptions, resulted in ripple effects on the prices of raw materials). Oil prices are expected to remain high in the near term as a lack of investment in North American oil over the past few years is limiting the ability of producers to increase supply. The Russia-Ukraine conflict is also adding a significant degree of supply uncertainty. Going forward, as demand growth cools and supply increases, the WTI oil price is expected to fall gradually, hitting a low of US$63 per barrel in 2025, before rising again, albeit modestly, in the second half of the projection period.
In reaction to surging inflation, both the Bank of Canada and the Federal Reserve in the United States started raising interest rates in early 2022. Despite a similar pace of increases in both countries, a slight depreciation of the Canadian dollar is expected in the short-term. While increases in oil prices were historically associated with an appreciation of the Canadian dollar, higher oil prices are less likely to lead to an increase in oil investment in the current cycle. Instead, the war in Eastern Europe is leading to an increase in the demand for the U.S. dollar, putting downward pressure on the Canadian dollar.
The overnight interest rate in Canada is expected to stabilize around 2023 and inflation to gradually return to the 2% target by 2025 and remain essentially unchanged over the 2026-2031 timeframe. After decreasing to USD $0.77 in 2023, the Canadian dollar is projected to appreciate modestly and reach USD $0.80 by the end of the projection period, partly reflecting the stronger pace of growth projected in exports relative to imports.
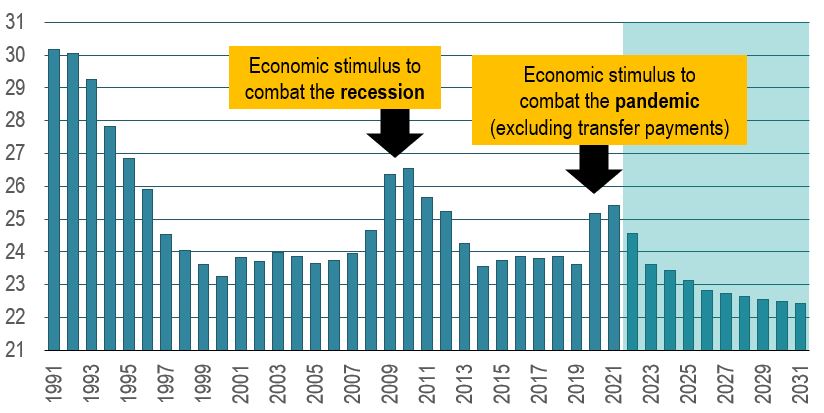
Figure 11 presents the evolution of Canada’s government spending as a share of total real GDP from 1991 to 2031. It shows that the ending of COVID-19 financial support programs and increasing pressures on public finances will lower growth in government spending.
Figure 11: Canada’s Government Spending as a Share of Total Real GDP (in percentage) (includes government consumption and investment)
Sources: Statistics Canada (historical) and ESDC 2022 COPS macroeconomic outlook. The shaded area represents projections.
Text version of Figure 11: Canada's Government Spending as a Share of Total Real GDP
After increasing rapidly in 2009 and 2010 due to the implementation of large stimulus packages to combat the recession, the share of government spending in total GDP fell back from 2011 to 2014, reflecting the federal and provincial governments’ decision to curtail growth in program spending in an attempt to return to fiscal balance.
This ratio remained relatively stable from 2015 to 2019, before jumping again in 2020-2021 as a result of the various government measures put in place to support the Canadian economy during the COVID-19 pandemic. Such measures included program spending and an increase in infrastructure investment, as well as unprecedented transfer payments to households and businesses (however, transfer payments do not enter the income- and expenditure-based GDP figures and are therefore excluded from the chart). For more information, see.
The ending of these measures is expected to lower total government spending in 2022 and 2023, with growth resuming in 2024 but at a slower pace than total GDP for the rest of the projection period in response to deficit reduction efforts and increasing pressures on public finances. As a result, the share of government spending in total GDP is expected to decline gradually, restraining the impact of the public sector on economic growth.
One positive impact of high inflation is that it has boosted nominal GDP growth in 2021 and 2022, resulting into additional tax revenues for the federal and provincial governments which have seen their deficits falling at a much faster pace than expected. While the federal government is expected to return to fiscal balance in 2026, the provinces are not expected to balance their books within the projection period, partly reflecting rising health care costs due to population aging.
Over the longer term, lower inflation will restrain nominal GDP growth in Canada, while the gradual slowdown in labour force growth will constrain employment and real GDP growth. This situation is expected to reduce growth in tax revenues and limit the capacity of governments to increase expenditures.
Composition of Growth in Aggregate Demand
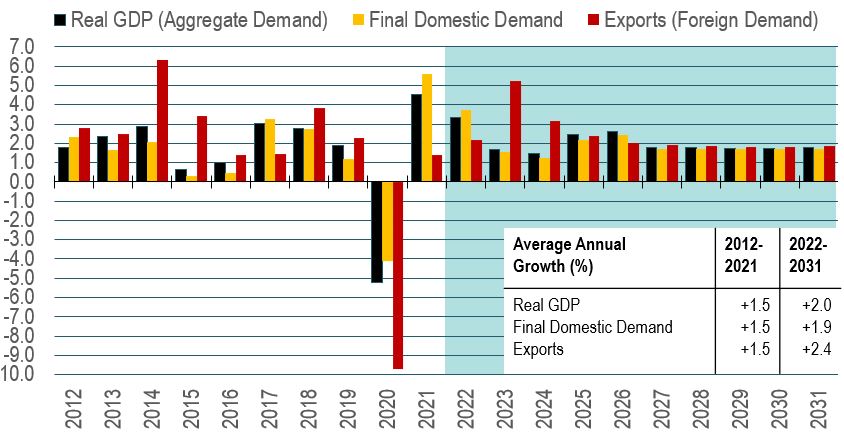
Figure 12 presents the annual percentage growth in real GDP, final domestic demand and exports over the 2012-2031 period. It shows that after fully recovering from the pandemic in 2022, Canada’s real GDP is projected to grow at a slower pace, in line with final domestic demand.
Figure 12: Growth in Real GDP, Final Domestic Demand and Exports (in percentage)
Sources: Statistics Canada (historical) and ESDC 2022 COPS macroeconomic outlook.
Text version of Figure 12: Growth in Real GDP, Final Domestic Demand and Exports
After falling at an unprecedented pace of 5.2% during the first year of the COVID-19 pandemic, real GDP in Canada partly recovered in 2021 (+4.5%) with the gradual lifting of public health measures. The economy is expected to keep growing at a solid pace in 2022 (+3.3%), driven by additional gains in final domestic demand (+3.7%) and exports (+2.2%), including a substantial increase in consumer spending on services, especially n hard-to-distance sectors such as travel and tourism, accommodation and food services, and arts, entertainment and recreation services.
While growth in exports is projected to be relatively strong over the next few years, growth in final domestic demand is expected to weaken, particulary in 2023 and 2024, in response to rising interest rates and reduced purchasing power resulting from higher inflation. After surging in recent years, a much weaker outlook is expected for residential investment and government spending over the projection period. More moderate growth in consumer spending and non-residential investment is also expected in the longer term, after pent up demand is absorbed.
On the supply side, slower growth in the labour force and a very tight labour market will limit employment growth and the Canadian economy’s ability to expand. In spring 2022, the unemployment rate was at its lowest level on record and the job vacancy rate was at historical highs. This resulted in a sharp decline in the number of unemployed people per vacant position, leading to an intensification of labour pressures across many sectors of the economy.
The resulting pace of growth in real GDP is expected to average 2.0% annually over the period 2022-2031, up from 1.5% over the period 2012-2021. This significant acceleration in output growth essentially reflects two factors:
- The COVID-19 pandemic led to a substantial decline in real GDP in 2020, lowering its average growth rate for the whole period 2012-2021.
- The strong pace of growth projected in GDP for 2022 (+3.3%) tends to boost the annual average growth rate for the whole period 2022-2031. In fact, real GDP growth falls to an average of 1.7% annually over the projection period when excluding year 2022.
Figure 13 presents the indexed growth in major components of real final domestic demand over the 2011-2031 period. It shows that growth in final domestic demand is expected to be driven by consumer spending and non-residential investment, especially in the near term.
Figure 13: Indexed Growth in Major Components of Real Final Domestic Demand
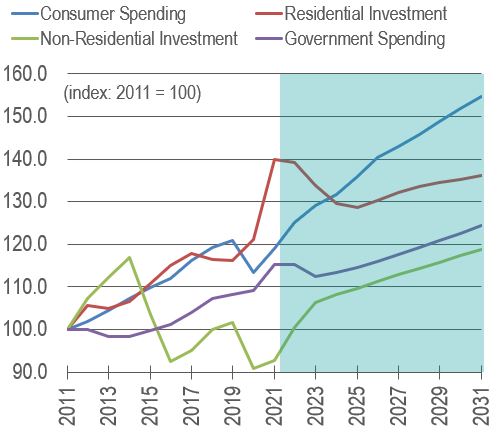
Sources: Statistics Canada (historical) and ESDC 2022 COPS macroeconomic outlook.
Text version of Figure 13: Indexed Growth in Major Components of Real Final Domestic Demand
Over the period 2022-2031, the outlook for consumer spending and non-residential investment is projected to improve relative to the period 2012-2021, while the outlook for residential investment and government spending is projected to weaken.
Growth in consumer spending is expected to accelerate, driven by faster growth in the purchase of services, particularly in the short-term. Household still have a large amount of savings and significant pent-up demand for services as consumption patterns shifted towards goods during the pandemic. A tight labour market and a pick-up in wage growth will also continue to support gains in labour income. However, rising interest rates, reduced purchasing power due to higher inflation and the gradual slowdown projected in employment growth are expected to restrain growth in consumer spending in the medium- to long-term.
After reaching historical highs in recent years, residential investment is projected to contract significantly until 2025 before rebounding modestly without fully recovering. The surge in housing prices, higher mortgage rates and changing demographics are expected to reduce new home construction and resale activity, restraining growth in renovation spending.
In contrast, non-residential investment is projected to return to positive growth, showing a better outlook in each of its sub-components. Following a steep decline in the past several years due to lower oil prices, business investment in engineering structures is expected to straighten, mainly in the short-term, supported by several energy and transportation projects. Investment growth in non-residential buildings is expected to accelerate, partly in response to high industrial capacity utilization rates and robust demand for warehouse space due to the growing adoption of e-commerce. After experiencing negative or anemic growth over the past decade, investment in machinery and equipment and intellectual property products is expected to strengthen markedly, driven by rapid technological innovations (automation), a tight labour market and the need to increase productivity.
As discussed previously, the ending of most financial support programs put in place during the pandemic is projected to reduce government spending in the short-term, while increasing pressures on public finances are expected to restrain growth in the longer-term.
Figure 14 presents the evolution of real net exports as a percentage of total real GDP from 1981 to 2031. It shows that the trade deficit is expected to decline gradually over the projection period, contributing positively to the increase in Canada’s economic activity.
Figure 14: Real Net Exports (as a percentage of total real GDP)
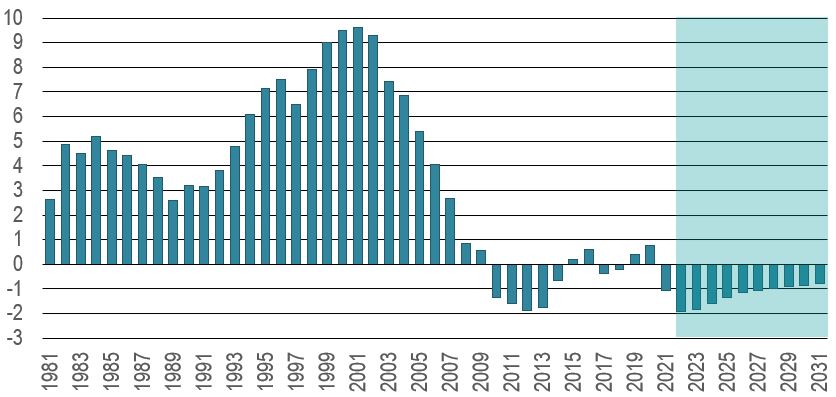
Source: Statistics Canada (historical) and ESDC 2022 COPS macroeconomic outlook. The shaded area represents projections.
Text version of Figure 14: Real Net Exports
In 2021, the value of exports fell behind the value of imports, resulting in a small trade deficit in Canada. The trade deficit is expected to amplify in 2022, before declining gradually over the projection period as growth in real exports is projected to exceed growth in real imports starting in 2023. Although net exports are expected to remain in negative territory for the whole period, the improvement in Canada’s trade balance will nevertheless contribute positively to real GDP growth year after year.
EXPORTS: After falling substantially in 2020 (-9.7%), exports of goods and services slightly rebounded in 2021 (+1.4%) and growth is expected to remain relatively modest in 2022 (+2.2%) due to the persistence of global supply chain disruptions. In 2023, growth is projected to accelerate significantly (+5.2%) as supply chain disruptions are expected to taper off and travel activity to recover with the complete lifting of public health restrictions in Canada and most parts of the world (increasing the ability and willingness of foreign citizens to travel to Canada and Canadian firms to do business abroad). However, exports are not expected to return to their pre-pandemic level before 2024. In the longer term, growth is expected to moderate from its post-pandemic recovery pace, in line with the gradual slowdown projected in the pace of growth for the U.S. economy, which accounts for about 75% of Canadian exports.
IMPORTS: After contracting markedly in 2020 (-10.8%), imports of goods and services strongly rebounded in 2021 (+7.7%) and are expected to keep growing at a solid pace in 2022 and 2023 (+5.0% and +4.7%), returning to their pre-pandemic level sometime in 2022. Over the short-term, growth will be largely driven by solid gains in consumer spending and business investment in machinery and equipment, which tend to have a high import content. The recovery in the travel industry is also expected to boost the imports of services (Canadian citizens travelling abroad and foreign firms doing business in Canada). Over the longer term, import growth is expected to moderate, in line with the slower pace of growth projected in final domestic demand.
|
Changes in external and domestic drivers of aggregate demand are projected to lead to changes in the pace of growth of industrial output and employment, which in turn will affect occupational labour demand over the period 2022-2031. See the Industrial Outlook (2022-2031) for more information. |