Canadian Occupational Projection System (COPS)
Occupational projections 2024-2033
|
The COPS projections were completed in the spring of 2024, at a time when immigration targets were higher than what was announced in October 2024. As immigration volumes affects both labour demand and supply, the number of occupations expected to face shortage conditions over the long-run is not anticipated to change substantially from the current exercise. |
NOC 2021 Training, Education, Experience and Responsibilities (TEER) classification
The current exercise uses the 2021 NOC, which is the most up-to-date version of the classification. It has 516 occupations that are classified based on their usual Training, Education, Experience and Responsibilities (TEER) as follows :
- TEER 0 : Management occupations
- TEER 1 : Occupations usually requiring a university degree
- TEER 2 : Occupations usually requiring a college diploma or apprenticeship of two or more years; or supervisory occupations
- TEER 3 : Occupations usually requiring a college diploma or apprenticeship of less than two years; or more than six months of on-the-job training
- TEER 4 : Occupations usually requiring a secondary school diploma; or several weeks of on-the-job training
- TEER 5 : Occupations usually requiring short-term work demonstration and no formal education
Sources of job openings
Job openings are positions that need to be filled due to :
- Expansion demand corresponds to the job creation generated by economic growth. It can be understood as “required employment” - that is, the number of people required to reach a certain level of production, given a specific level of productivity.
- Replacement demand corresponds to any existing jobs which will be vacated and that will require to be filled due to retirements, deaths and emigration.
Job Openings due to Economic Growth
Expansion Demand (Employment Growth)
Over the next 10 years, economic growth is expected to generate about 2.6 million new jobs (259,000 on average every year), which represent an annual average growth rate of 1.2%. In the long term, job creation will become increasingly constrained by the slower pace of growth anticipated in the labour force (see the document Macroeconomic & Industrial Outlook).
Occupational employment is driven by the degree to which the various occupations are utilized in each industry (occupational effect) and by the economic growth of the industries that employ them (industrial effect).
The occupational effect impacts occupational employment via the productivity and utilization levels of each of the occupations in the economy encompassed by technological advances. This effect sometimes leads to job losses in some occupations, but also to job growth in some others or even the creation of new occupations.
While expansion demand is primarily driven by macroeconomic and demographic factors, technology progress is also reallocating jobs at the industrial and occupational levels.
Automation and Artificial Intelligence (AI) are the main drivers of these technological changes. With the introduction of Generative AI, machines can now perform even non-routine, cognitive and interpersonal tasks that were previously considered non-automatable.
- As the integration of automation and Artificial Intelligence (AI) in the workplace continue to accelerate, there has been growing interest in understanding how these rapid technological advances will impact the labour market. Historically, technology has created more jobs than it has displaced, through reallocation of jobs at the industrial and occupational levels.
Automation can affect employment in two opposing ways : negatively, by displacing workers from tasks they previously performed, and positively, by increasing the demand for labour in other jobs or industries. However, most experts agree that large-scale job losses are unlikely over the next 10-20 years, as automation is most likely to affect specific tasks, rather than entire occupations.
- While automation temporarily displaces workers and causes short-term labour market disruptions, the resulting productivity gains lead to an increase in real wages, which in turn increase the demand for goods and services, eventually creating new jobs to meet the greater demand. Occupations with a high proportion of routine and repetitive tasks – which also typically require lower educational levels and offer lower pay – are more exposed to automation.
AI related job transformation can affect employment in two ways : by AI potentially replacing tasks in the future, or by complementing them. In 2021, 31% of workers in Canada were in occupations in the first category, while 29% of workers were in the second (Mehdi and Morisette, 2024).
- Unlike traditional automation, AI is more likely to transform the jobs of highly educated workers performing non-routine and cognitive tasks. AI related job transformation can impact jobs by either replacing tasks or by complementing them. Occupations that could face high exposure to AI, and whose tasks could be replaced by AI include Computer programmers and interactive media developers, Computer network technicians, and Economists. Occupations that could face both high exposure to AI and high complementarity include General practitioners and family physicians, Secondary school teachers, and Electrical Engineers (Mehdi and Morisette, 2024).
In occupations highly exposed to AI (but that don’t require specialized AI skills), management, communication and digital skills were the most in demand in 2021-2022. However, the demand for these skills has declined in these occupations between 2012-13 and 2021-22, while the demand for emotional, social and language skills has increased (OECD, 2024).
- AI also has a greater potential to complement tasks performed by highly educated workers, but leveraging these benefits depends on workers having the necessary skills to utilize AI effectively. In occupations highly exposed to AI but not requiring specialized AI skills, the demand for emotional, social and language skills has increased the most from 2012-13 to 2021-22 along with the demand for skills that may be complementary to AI, such as production and physical skills (OECD, 2024). Some experts also argue that AI will be complementary to low- and medium-skilled workers and potentially even have an equity positive impact, as these workers might see relatively larger gains in their work performance with AI as a work tool, compared to high-skilled workers (Noy and Zang, 2023; Brynjolfsson et al, 2023).
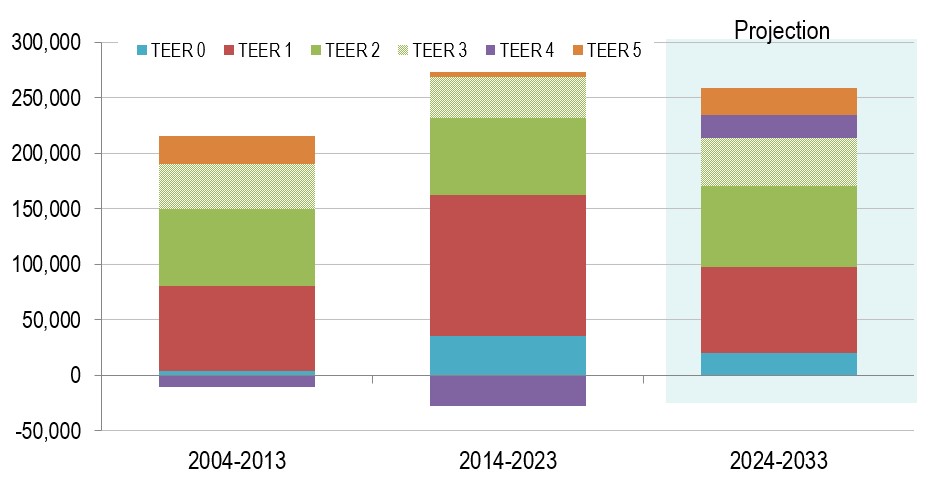
Figure 1 shows that over the next ten years, over 80% of new job openings arising from economic growth are projected to be mainly in management positions and in those that usually require post-secondary education (TEER 0 to 3).
Figure 1 : Average Annual Employment Change by TEER Category
Sources : Statistics Canada (historical data) and ESDC 2024 COPS projections.
Text version of Figure 1 : Average Annual Employment Change by TEER Category
About 83% of the projected employment growth over the next 10 years is expected to be in occupations that usually require post-secondary education (university, college or apprenticeship) or in management occupations (TEERs 0 to 3). As a comparison, those occupations accounted for more than 100% of all the net job creation during the preceding decade, as employment in occupations usually requiring a secondary school diploma; or several weeks of on-the-job training (TEER 4) fell and those usually require short-term work demonstration, and no formal education (TEER 5) increased only marginally. The projected trend over the next decade is a continuation of what has been observed over the past 20 years as the Canadian economy became more knowledge-intensive, automatized and with stronger health care needs.
The demand for jobs in occupations usually requiring high school education or no formal education (TEERs 4 and 5) is also projected to grow, but at a lower rate than those with higher educational or training requirements. The expected demand for administrative and financial support jobs; care providers and public support occupations; sales and service representatives and support jobs; message distribution, equipment operators, maintenance workers and transportation helpers and labourers; agriculture and natural resources workers and labourers; and machine operators and labourers will support employment growth in this cluster of occupations usually requiring high school education or nor formal education.
Figure 2 shows that stronger employment growth is projected in occupations that usually require post-secondary education.
Figure 2 : Distribution of Expansion Demand by TEER Category, Projection 2024-2033
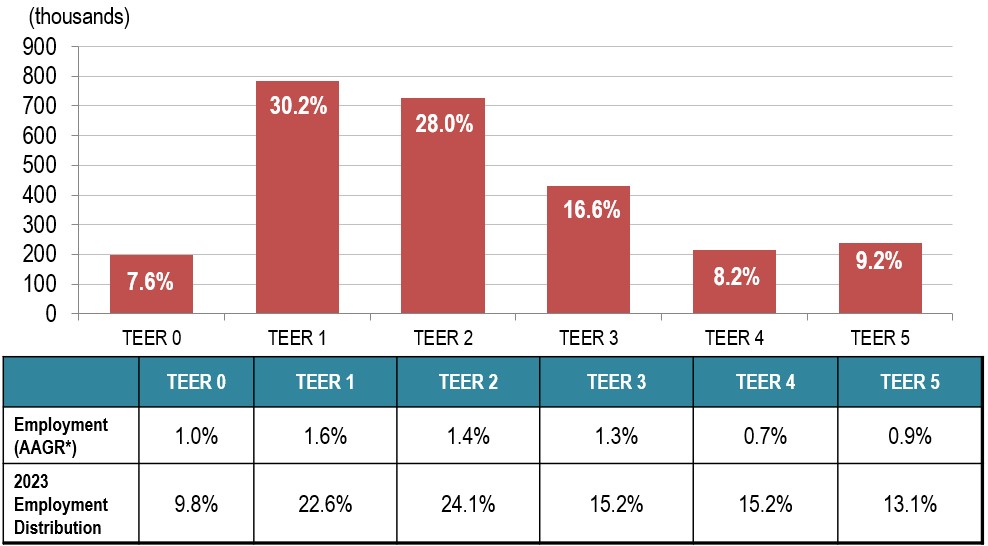
Sources : Statistics Canada (historical data) and ESDC 2024 COPS projections. *AAGR : Annual Average Growth Rate
Text version of Figure 2 : Distribution of Expansion Demand by TEER Category, Projection 2024-2033
In 2023, the largest share of employment was in occupations that usually require a college diploma, or apprenticeship training of two or more years, or supervisory occupations (TEER 2), closely followed by those that usually require a university degree (TEER 1). Occupations that usually require a college diploma, or apprenticeship training of less than two years, or more than six months of on-the-job training (TEER 3); and those that usually require a secondary school diploma, or several weeks of on-the-job training (TEER 4) ranked third and fourth respectively.
Over the projection period, occupations that usually require a university degree (TEER 1) are expected to have the strongest overall employment growth, contributing also to the largest number of jobs created among all TEER categories. This is mostly the result of strong growth expectations in occupations related to professional services in health, as well as in the natural and applied sciences fields, especially among the information technology sector.
Occupations that usually require a college diploma or apprenticeship training of two or more years, or supervisory occupations (TEER 2); and those that require a college diploma or apprenticeship training of less than two years, or more than six months of on-the-job training (TEER 3) are projected to have the second and third largest contribution in terms of job creation.
Stronger employment growth among occupations that typically require post-secondary education is largely explained by a more limited impact of technological progress and the strong labour requirements in the health care sector as a result of population aging.
On the other hand, occupations that typically require a secondary school diploma, or several weeks of on-the-job training (TEER 4); and those usually requiring short-term work demonstration and no formal education (TEER 5) have a higher content of routine and manual tasks that can be more easily automated, which partially limits their employment growth.
Figure 3 shows that the situation will result in a slight increase in the share of management occupations and those that usually require university education within total employment.
Figure 3 : Distribution of Employment by TEER Category
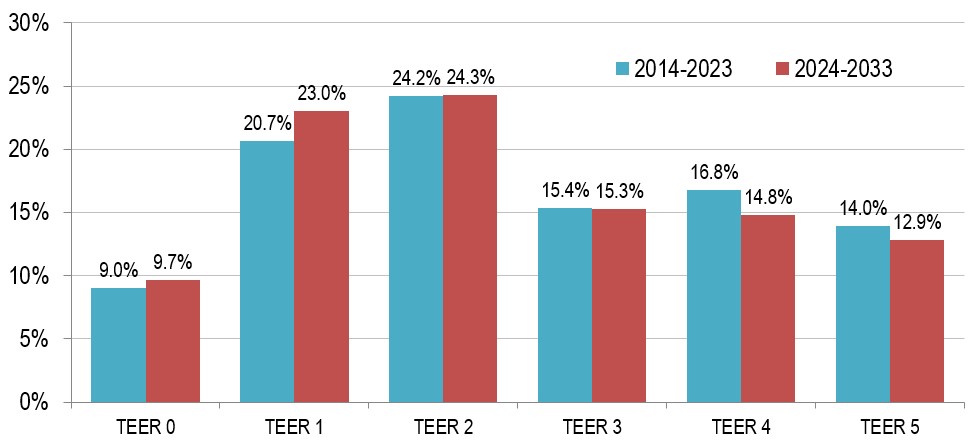
Sources : Statistics Canada (historical data) and ESDC 2024 COPS projections.
Text version of Figure 3 : Distribution of Employment by TEER Category
With about two-thirds of expected employment growth in occupations among TEER categories 0 to 2 over the period 2024-2033, their projected proportion among total employment is expected to increase to 57.0% on average over the projection period, up from 53.9% of total employment on average over the period 2014-2023.
Figure 4 shows that health occupations are projected to experience the strongest growth in employment.
Figure 4 : Employment Growth by Broad Occupational Category, Projection 2024-2033
(average annual growth, in percentage)
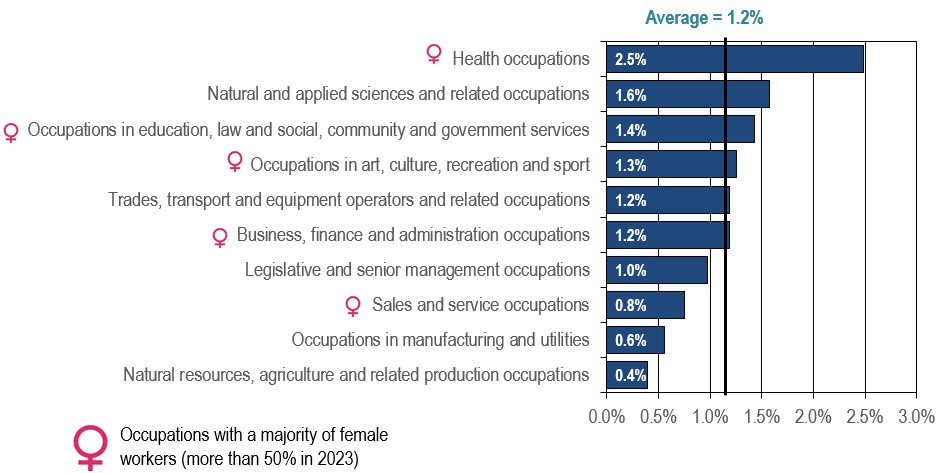
Sources : Statistics Canada (historical data) and ESDC 2024 COPS projections.
Text version of Figure 4 : Employment Growth by Broad Occupational Category, Projection 2024-2033
Among the 10 broad occupational categories, health occupations are expected to record the strongest growth in employment. This is in line with the health industry having the strongest projected growth among all of the 42 industries (see the Macroeconomic & Industrial Outlook document).
Natural and applied science; as well as occupations in education, law and social, community and government services are distant followers. These two broad occupational groups have a majority of workers in TEER 1 occupations. They will benefit from strong employment growth in industries like computer system design services; legal and accounting services, consulting and other professional occupations; as well as colleges, CEGEPSs and vocational schools; and finance, insurance, real estate and leasing services; where they are largely employed.
Business, finance and administrative occupations; occupations in art, culture, recreation and sport; as well as trades, transport, and equipment operators and related occupations are expected to record employment growth similar to the all-occupations average. They will be supported by strong gains in the industries of finance, insurance, real estate and leasing services; arts, entertainment and recreation services; and truck and ground passenger transportation services; as well as construction, respectively.
Sales and services occupations; natural resources, agriculture and related production occupations; as well as occupations in manufacturing and utilities are expected to have the weakest expansion demand, in line with weaker projected employment growth in their main industrial employers : retail sales; food services; primary industries like agriculture; and several manufacturing industries. Those are also the broad occupational categories with the highest share of workers in TEERs 4 and 5.
Figure 5 shows that occupations with a high content of interpersonal and cognitive tasks are expected to have the strongest job growth, with potentially lower negative impacts from technological progress and stronger skills complementarity with AI.
Figure 5 : Employment Growth by Type of Tasks
(indexed Growth; 2019=100)
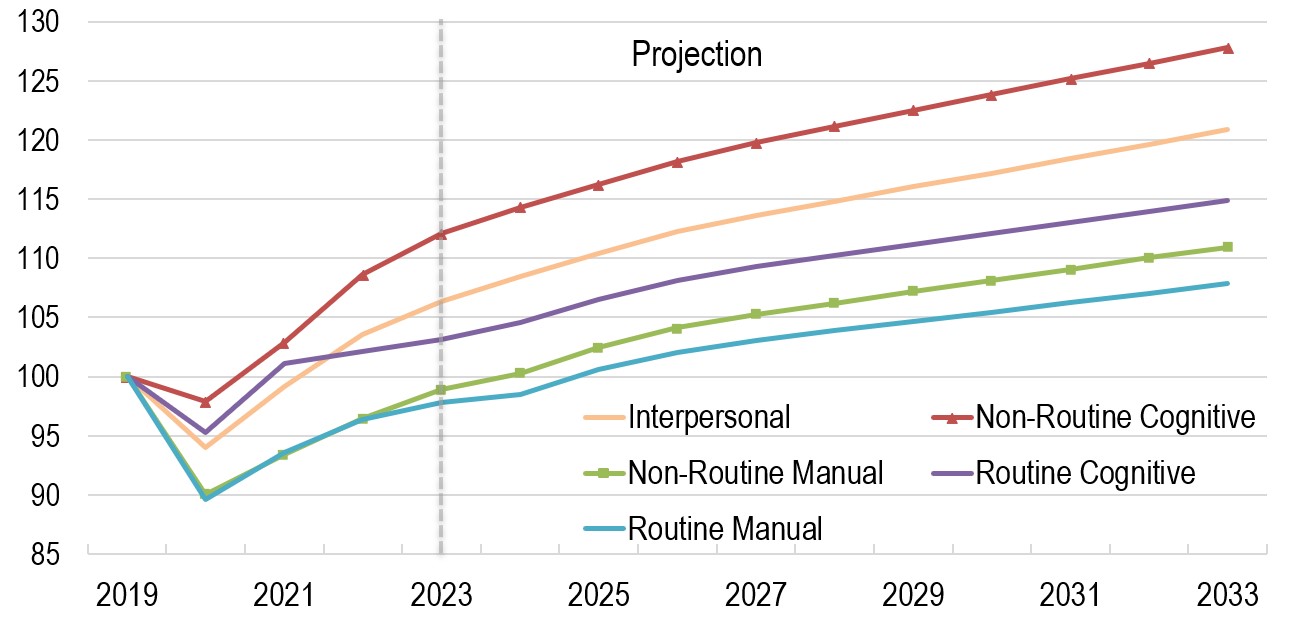
Sources : Author’s Calculations using Statistics Canada and Job Bank (historical data), and ESDC 2024 COPS projections.
Text version of Figure 5 : Employment Growth by Type of Tasks
This figure shows that occupations with a high content of manual tasks were more severely impacted during the pandemic, in depth and in length, due mostly to the restrictions imposed on businesses that are characterised by close contact and high degree of in-person interaction.
Looking ahead, the increasing automation of routine tasks will limit growth among occupations with a high content of these tasks. For example, clerical work, some manufacturing jobs, and some related to basic customer service are highly susceptible to automation, limiting their employment growth.
On the other hand, the strong demand for cognitive, technical, and digital skills is expected to support growth for occupations with high content of cognitive tasks.
As AI becomes a bigger part of the technological progress, its impact is expected to be more evenly spread out among all occupations. However, occupations with a higher concentration of cognitive and interpersonal tasks are expected to be impacted negatively less from technological progress.
Job Openings in Existing Positions
Replacement Demand
Figure 6 shows that retirements will continue to represent the most important source of replacement demand.
Figure 6 : Sources of Replacement Demand
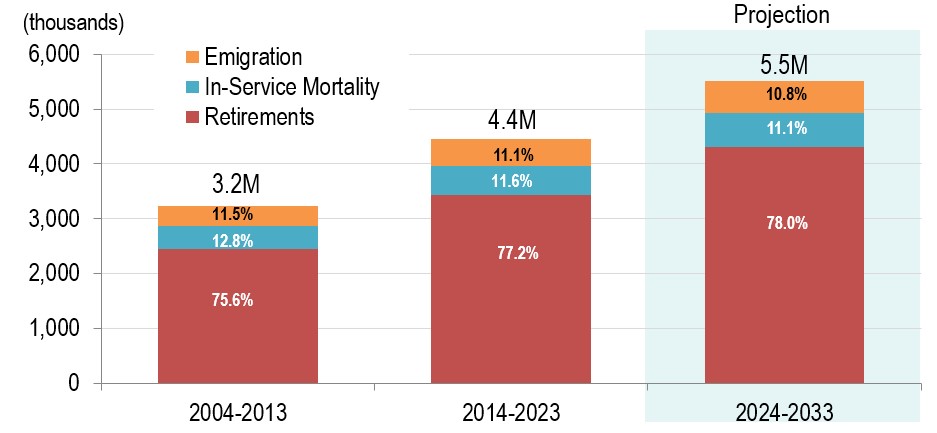
Sources : Statistics Canada (historical data) and ESDC 2024 COPS projections.
Text version of Figure 6 : Sources of Replacement Demand
Economic growth is not the only source of job openings. Replacement demand is the other major source of job openings. These openings are created by the following factors :
- Retirements : approximately 4.3 million positions are expected to open up due to retirements over the period 2024-2033. As the baby-boom generation continues to retire, the replacement demand generated from this source is expected to continue to rise. Over the coming decade, retirements are projected to represent 78% of replacement demand, about the same as over the period 2014-2023 (77.2%), and higher than to the 75.6% recorded over the period 2004-2013;
- In-service mortality : about 641 thousand jobs are expected to open up due to in-service mortality (mortality while employed); and
- Emigration : nearly 598 thousand jobs are expected to need to be filled due to emigration.
Figure 7 shows that retirements are expected to increase at a faster rate than employment in the first half of the projected period before slowing down once most of the Baby boomers will have retired.
Figure 7 : Overall Retirement Rate and Indexed Growth of Retirements and Employment
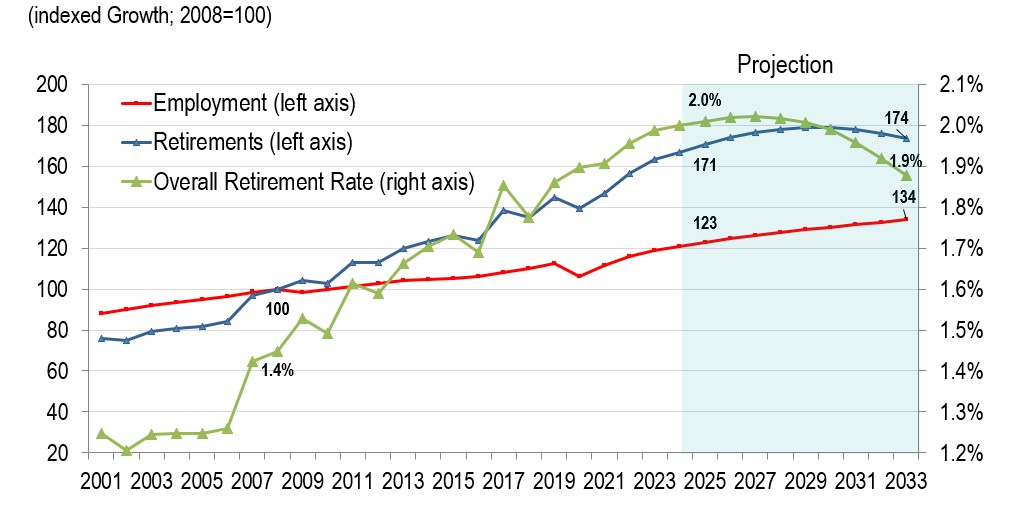
Sources : Statistics Canada (historical data) and ESDC 2024 COPS projections.
Text version of Figure 7 : Overall Retirement Rate and Indexed Growth of Retirements and Employment
Retirement growth and employment growth were comparable prior to 2007, but the former started outpacing the latter since then. As a result, the overall retirement rate, expressed as the number of retirees per employed worker, grew from 1.3% in 2006 to 2.0% in 2023.
This overall retirement rate is expected to peak around 2027. Accordingly, the increase in the number of retirees seen since 2008 is expected to continue, at least over the first seven years of the projection period. However, as all baby boomers will be over 65 years old by 2030, the volume and rate of retirements will reach a plateau before declining afterward and beyond 2033.
The number of retirements is projected to rise from an annual average of 344,000 over the period 2014-2023 to 431,000 annually over the period 2024-2033.
The expected continued rise in the number of retirements and the overall retirement rate, at least over the first half of the projection period, is explained by the aging of the Canadian population.
More members of the baby boom generation will reach retirement age. The proportion of the population that are 50 years old or older is expected to continue to stabilise, at around 46%. The upward trend in the retirement rate of these workers is projected to continue gradually, but it is expected to reach a plateau in the end of the 2020s as all baby boomers will be 65 years old or older, and most of them would have retired before the end of the projection period.
Figure 8 shows that about three-quarters of projected retirements are in occupations that usually require post-secondary education or in management occupations.
Figure 8 : Distribution of Retirements by TEER Category, Projection 2024-2033
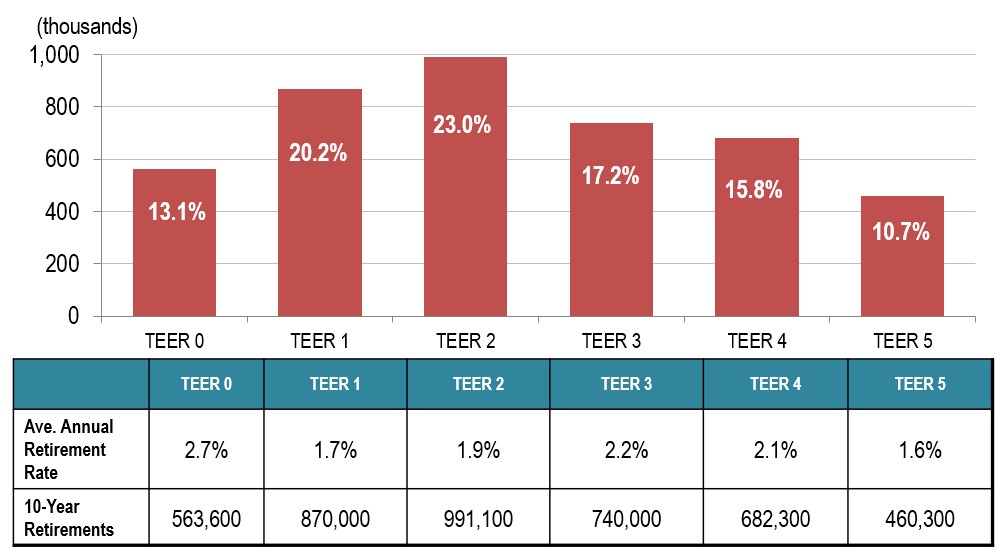
Sources : Statistics Canada (historical data) and ESDC 2024 COPS projections.
Text version of Figure 8 : Distribution of Retirements by TEER Category, Projection 2024-2033
The majority of the retirements are projected to be in occupations that have the largest proportions of employment. That is, they are expected to be in larger quantities in occupations that usually require university and college education or apprenticeship certificate (TEER 1, 2 and 3) and in those that usually require high school education (TEER 4).
Retirements will generate a disproportionately larger number of job openings in management occupations (TEER 0) as these workers tend to be significantly older than average. On the other hand, workers in occupations that usually require short-term work demonstration and no formal education (TEER 5) tend to be younger than average and tend to retire at a similar age than the all-occupations average, translating into a lower volume of retirements.
Concerning occupations that usually require university education, the strong employment growth in recent years as well as during the projection period means that retirement will represent a lower share relative to their employment share.
Therefore, projected retirement rates are the highest in management occupations and the lowest in occupations that usually require university education and short-term work demonstration and no formal education.
Yet, the distribution of retirements by TEER is projected to remain relatively stable over the period 2024-2033 when compared to the preceding decade.
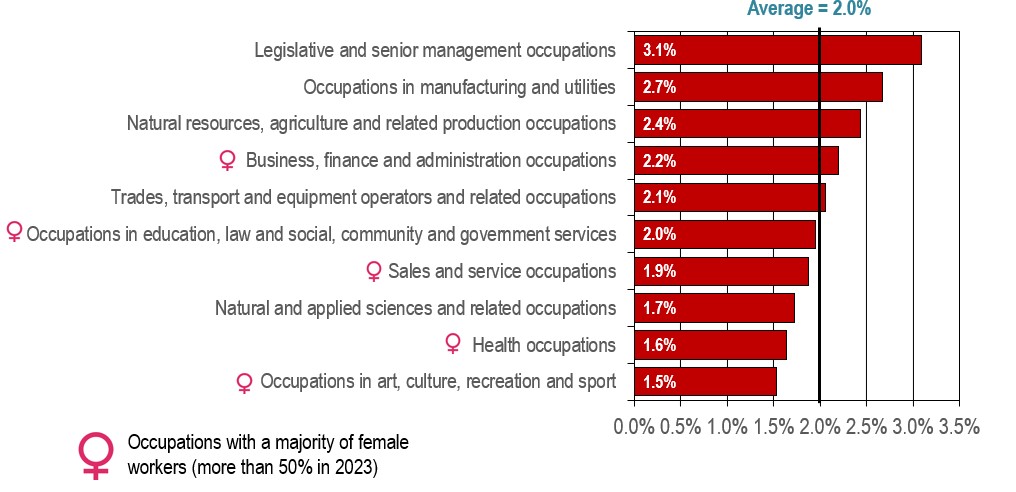
Figure 9 shows that legislative and senior management occupations are projected to experience the highest retirement rate, followed by occupations in manufacturing and utilities.
Figure 9 : Retirement Rate by Broad Occupational Category, Projection 2024-2033
Sources : Statistics Canada (historical data) and ESDC 2024 COPS projections.
Text version of Figure 9 : Retirement Rate by Broad Occupational Category, Projection 2024-2033
Retirement rates are mostly determined by the distance between two variables : the median age of retirement and the share of workers that are within a few years of that age. In general, occupations that on average have a larger proportion of older workers, tend to have higher retirement rates.
Among the 10 broad occupational categories, legislative and senior management occupations are expected to have the highest retirement rate followed by occupations related to manufacturing and utilities, which tend to have a higher share of older workers.
On the other hand, occupations with younger workers such as those in art, culture, recreation and sport; and sales and services occupations have the lowest retirement rates.
In case of health-related occupations; and natural and applied sciences occupations, a larger share of their workers are part of the core-aged group (aged 25 to 54), and, accordingly, a lower share of them are aged 55 and over.
Total Job Openings
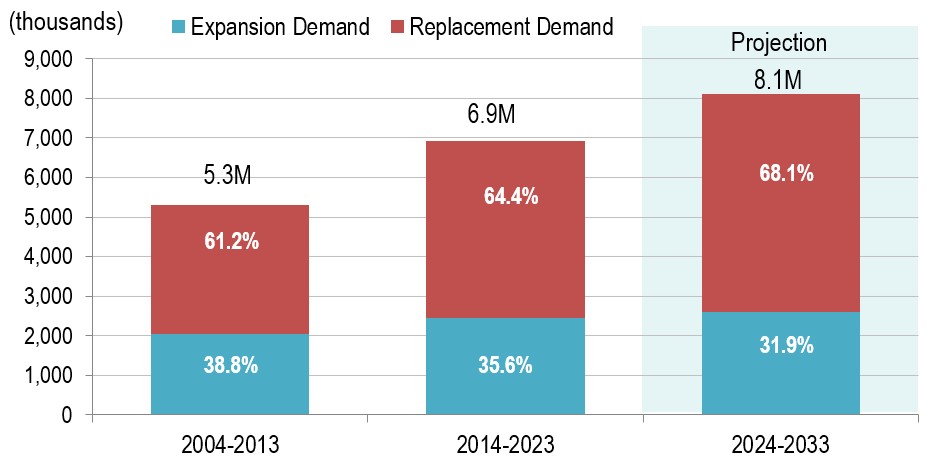
Figure 10 shows that replacement demand is projected to represent more than two thirds of all job openings over the coming decade.
Figure 10 : Job Openings from Expansion and Replacement Demand
Sources : Statistics Canada (historical data) and ESDC 2024 COPS projections.
Text version of Figure 10 : Job Openings from Expansion and Replacement Demand
A total of 8.1 million job openings (those due to economic growth plus those due to replacement needs) are expected over the period 2024-2033. About 2.6 million are projected to be new positions as a result of increasing economic activity (expansion demand or employment growth), while over 5.5 million are projected to be existing positions being vacated due to replacement needs (retirements will account for 4.3 million of the 5.5 million positions being vacated).
As a result, replacement demand (mainly from retirements) is expected to represent 68.1% of all projected job openings over the period 2024-2033, up from 64.4% in 2014-2023, and 61.2% in 2004-2013.
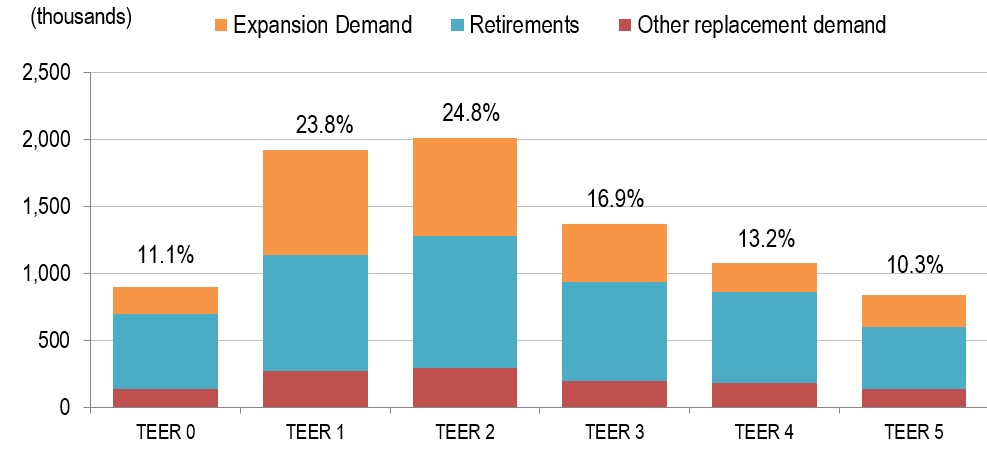
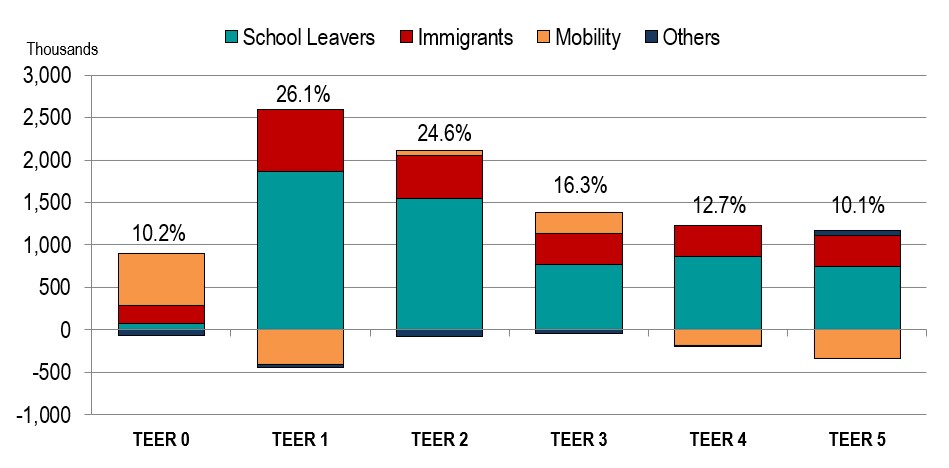
Figure 11 shows that three-quarters of all projected job openings are in occupations that usually require post-secondary education or in management occupations.
Figure 11 : Job Openings from Expansion and Replacement Demand by TEER Category, Projection 2024-2033
Sources : ESDC 2024 COPS projections.
Text version of Figure 11 : Job Openings from Expansion and Replacement Demand by TEER Category, Projection 2024-2033
Looking at the TEER categories, about three-quarters (or about 6.2 million) of the job openings are expected to be in occupations that usually require university or college diploma or apprenticeship training or in management occupations (TEERs 0, 1, 2 and 3).
In fact, 82.5% of new jobs created by economic expansion are projected to be in occupations generally requiring post-secondary education or in management positions, whereas 73.5% of job openings due to replacement will be in these occupational groups, for a combined average of 76.4% (around 6.2 million).
Given that 82.5% of the new jobs are expected to be in occupations that usually require post-secondary education (TEERs 1, 2 and 3 : university, college or vocational) or in management occupations (TEER 0) over the period 2024-2033, their proportion among total employment will continue to rise in the coming decade. Indeed, the share of occupations that usually require post-secondary education (university, college or vocational) and management occupations out of total employment has grown from 66.4% in 2013 to 71.7% in 2023, and it is expected to reach 72.9% in 2033.
Over the next ten years, about one-quarter of job openings (around 1.9 million) are expected to be in occupations usually requiring high school education (TEER 4); or several weeks of on-the-job training or short-term work demonstration and no formal education (TEER 5).
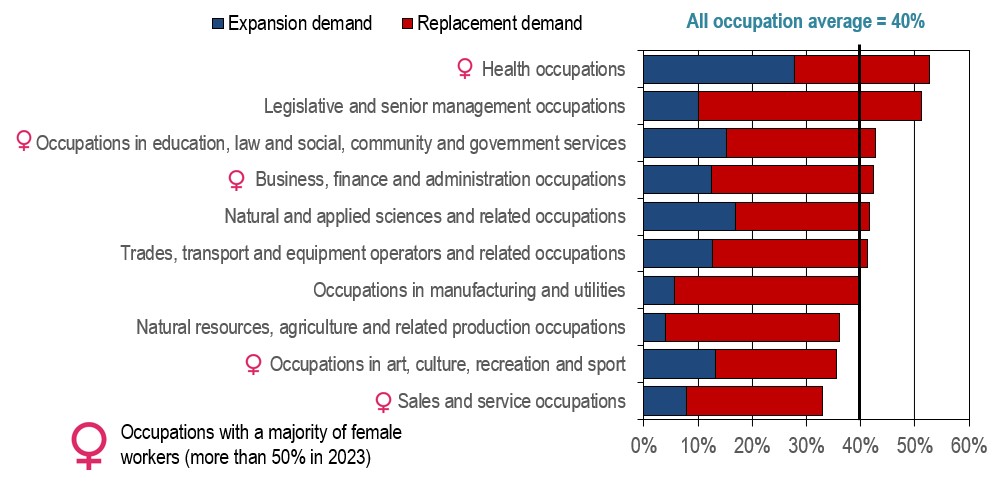
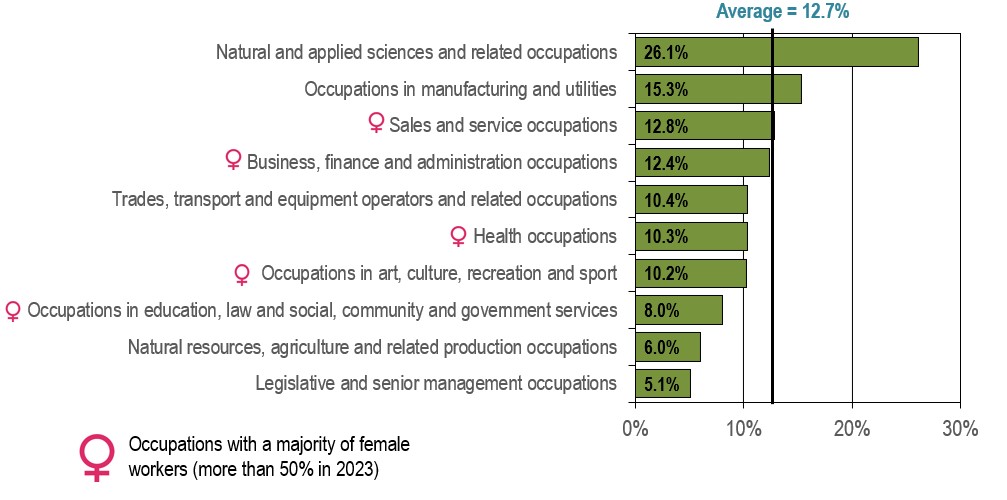
Figure 12 shows that health occupations, as well as legislative and senior management occupations are projected to experience the highest job opening rate.
Figure 12 : Job Opening Rate by Broad Occupational Category, Projection 2024-2033
(Job openings as a % of 2023 employment, in percentage)
Sources : Statistics Canada (historical data) and ESDC 2024 COPS projections.
Text version of Figure 12 : Job Opening Rate by Broad Occupational Category, Projection 2024-2033
Among the 10 broad occupational categories, health related occupations, as well as legislative and senior management occupations are expected to have the highest job opening rate :
- This reflects strong expansion demand in the case of health occupations and strong replacement demand in the case of legislative and senior management occupations.
- The health-related occupations category is the only one for which employment growth is slightly more important than replacement demand, accounting for 52.9% of the projected number of job openings.
- The second highest share of employment growth is found among natural and applied sciences and related occupations, where it is expected to account for 40.6% of total job openings.
On the other hand, natural resources, agriculture and related production occupations; as well as occupations in manufacturing and utilities are the two categories for which replacement demand is expected to be the most important source of job openings, accounting for 88.8% and 85.7% respectively.
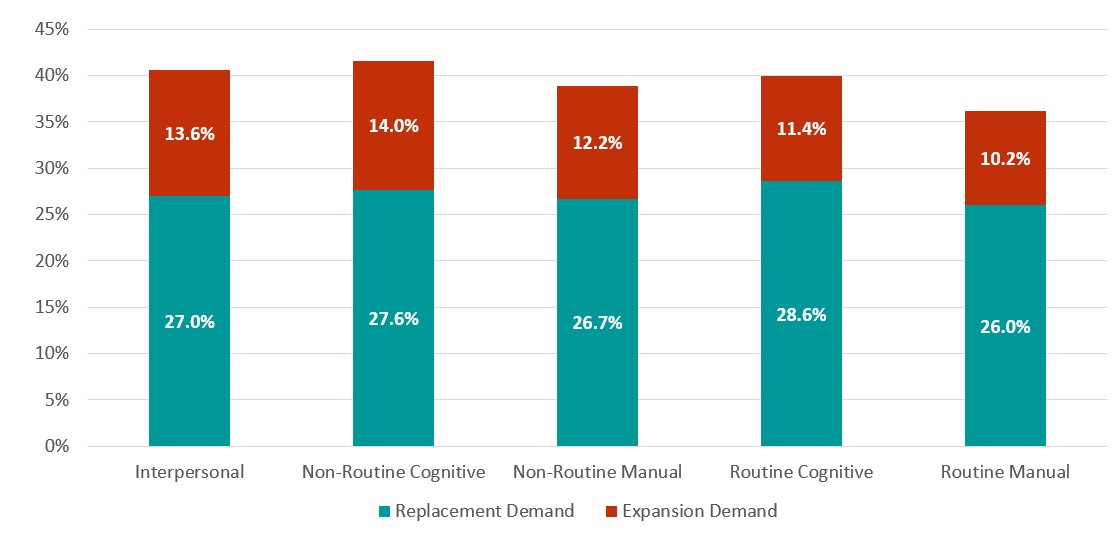
Figure 13 shows that Replacement demand rates are projected to be similar among types of tasks. However, occupations with higher content of interpersonal and non-routine cognitive tasks are expected to have the strongest employment growth.
Figure 13 : Job Opening Rate by Type of Task, Projection 2024-2033
(Job openings as a % of 2023 employment)
Sources : Author’s Calculations using Statistics Canada and Job Bank (historical data), and ESDC 2024 COPS projections.
Text version of Figure 13 : Job Opening Rate by Type of Task, Projection 2024-2033
Over the projection period, the different task types are not expected to have a substantial impact on the replacement needs, except mildly on those with high content of routine manual tasks. That is, replacement needs are expected to be similar independently of the task concentration, with replacement needs hovering between 26% and 28.6% of 2023 employments levels. Only occupations with a higher concentration of routine manual tasks are expected to have just slightly lower replacement needs. At the same time, this type of occupations are also expected to have the lower projected employment growth. These are occupations mostly related to manufacturing activities, with some related to the primary industries as well as to sales and services.
On the other hand, occupations with a high content of interpersonal (e.g. some in sales and services, social work, health, education and management) and non-routine cognitive tasks (e.g. engineering, natural science, analysts and managers) are expected to have stronger employment growth. These occupations are expected to be less negatively impacted by technological progress and their skills will be largely complemented by the increasing exposure and use of AI.
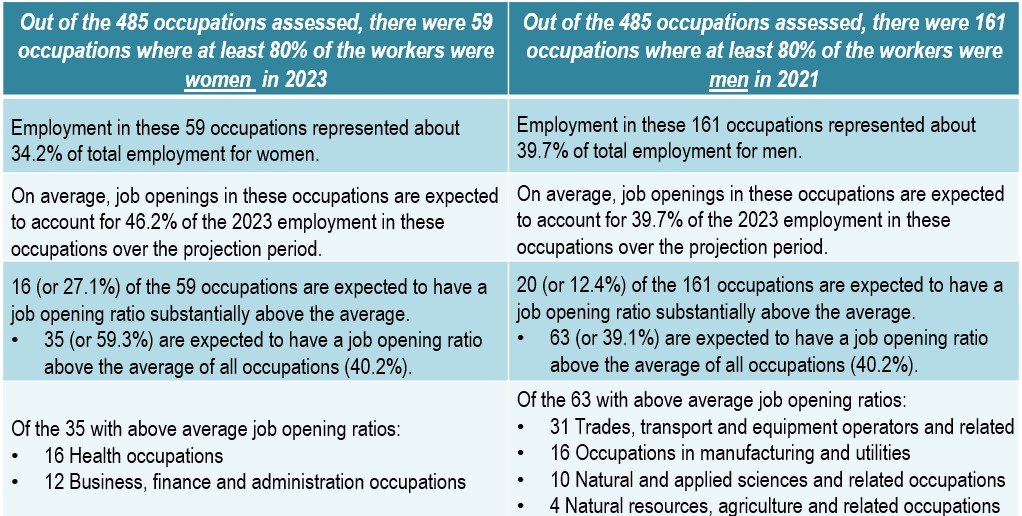
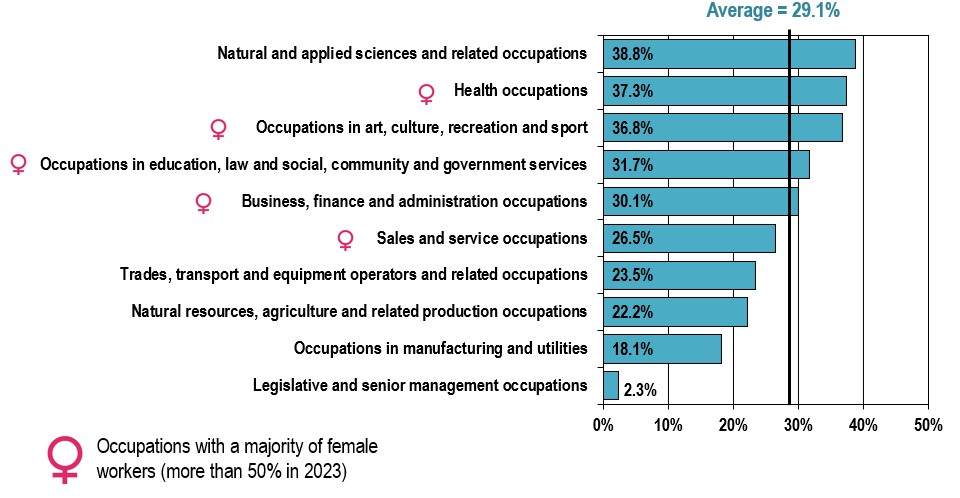
Table 1 shows that occupations where women made up at least 80% of the employment in 2023 are expected to have, on average, slightly higher rates of job openings compared to occupations with less than 20% female representation. This is largely because the former have relatively stronger job creation and a higher proportion of retirements.
Sources : Statistics Canada (historical data) and ESDC 2024 COPS projections.
In 2023, 59 occupations had a significantly high concentration of female workers, a number lower than the 161 with a substantially elevated proportion of males.
The sum of the projected job openings of all the occupations with a significant concentration of female workers is expected to represent about 46.2% of their cumulative 2023 employment level. Of these, 35 occupations (59.3%) are projected to have ratios above the average of 40.2%. The larger employment size among these occupations, the relatively stronger job creation and their generally higher proportion of retirements explain this situation. Occupations related to health; as well as business, finance and administration represent the large majority of such occupations.
In comparison, job openings will represent about 39.7% of the 2023 employment among occupations with a strong concentration of males. Of these, 63 occupations (39.1%) are expected to have above average job openings ratios. Occupations related to trades, transport and equipment operators; manufacturing; natural and applied sciences; as well as natural resources and agriculture, account for the majority of such occupations.
Job Seekers
Job seekers include three primary groups : school leavers, new immigrants and other job seekers such as students and re-entrants.
- School leavers are people leaving their full-time education programs (either as dropouts or graduates) to participate in the labour force. They are considered at their highest level of education completed. For example, a post-secondary dropout is considered as a high-school graduate.
- New immigrants are foreigners who enter Canada each year (under any immigration class) as permanent residents and participate in the labour market.
- Other job seekers include :
- Occupational movers : those who change occupations without leaving the labour market.
- Net re-entrants : those who had previously left the labour force and return to participate in the labour market.
- Working students : individuals who look for work while going to school.
* The last two subgroups (i.e. net re-entrants and student workers) are negligible in size. As a result they are not explicitly considered in this report as their inclusion has no impact on the main results. In particular, student workers are left out because, although they represent a sizeable number of workers in the labour force, their number is expected to remain relatively stable (i.e. the number of students seeking employment over 2024-2033 will only be slightly higher than over the previous decade). Both net re-entrants and student workers are combined in the category “others”.
Job Seekers
from the Education System : School Leavers
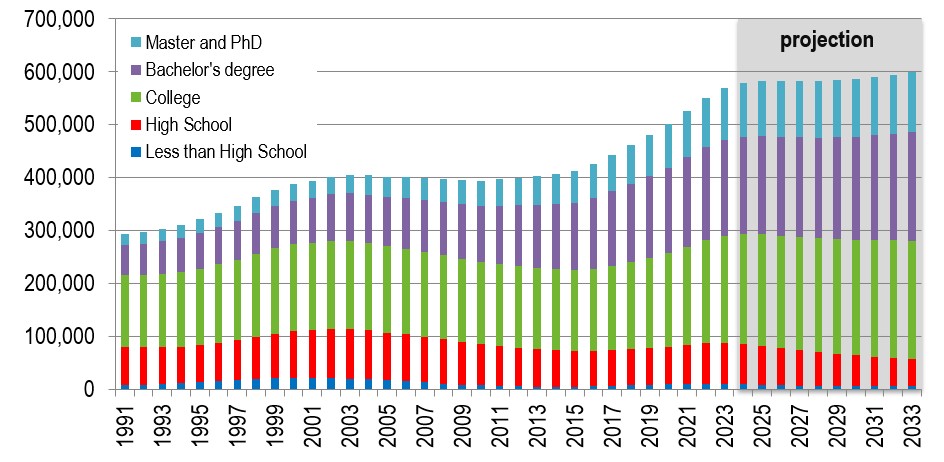
Figure 14 shows that over the period 2024-2033, the number of school leavers entering the labour market is projected to increase, led entirely by post-secondary education (PSE) graduates.
Figure 14 : School Leavers by Education Level, 1991-2033
Sources : Statistics Canada (historical data) and ESDC 2024 COPS projections.
Text version of Figure 14 : School Leavers by Education Level, 1991-2033
Over the period 2024-2033, it is expected that the number of school leavers entering the labour market will continue to increase, but at a slower pace than the increase recorded during the previous decade.
On average, there were 478,000 school leavers per year over the 2014-2023 period. This is expected to increase to 586,600 annually over the projection period. More particularly :
- the numbers of school leavers with a college and those with a university education are projected to increase at annual average growth rates of 1.3% and 1.0% respectively;
- the numbers of school leavers with a high school education is projected to decrease at an annual average growth rate of 3.9%;
- the number of school leavers with less than a high school education is projected to remain very low and is projected to represent less than 1.0% of all school leavers by 2033.
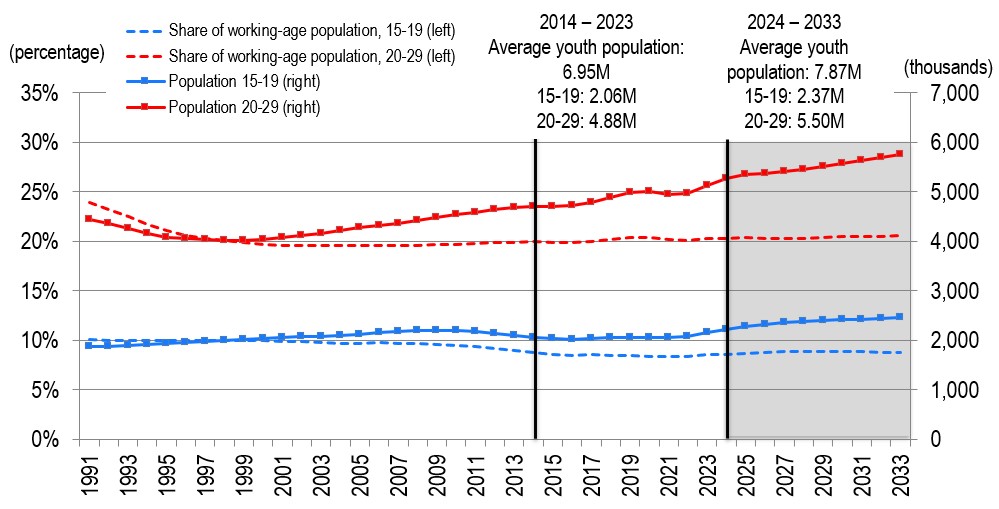
Figure 15 shows that the projected increase in school leavers with PSE results from the larger size of youth population over the next decade, due to higher immigration and a generational shift.
Figure 15 : Populations Aged 15 to 19 and 20 to 29, and their Shares out of the Total Working Age Population (15-64), 1991-2033
Sources : Statistics Canada (historical data) and ESDC 2024 COPS projections.
Text version of Figure 15 : Populations Aged 15 to 19 and 20 to 29, and their Shares out of the Total Working Age Population (15-64), 1991-2033
Over the 2024-2033 projection period, the share of the older youth group (aged 20-29) out of the total working age population (15-64) is expected to average 20.4% annually, compared to 20.1% over the 2014-2023 period.
As such, the annual average population of this youth group (aged 20-29) is expected to be 12.7% higher over the projection period (2024-2033) than during the previous ten years (2014-2023), averaging 5.5 million annually. As this age group is the main source population for school leavers with a post-secondary education (PSE), the number of job seekers leaving the PSE system is also expected to increase.
The annual average number of younger youth (aged 15-19) is expected to be about 2.37 million over the projection period, a 14.9% increase relative to the previous ten years, largely attributed to larger inflow of immigrant families with young kids. Although this age group is the main source population for school leavers with a high school education or less, most of them are expected to continue and enroll into post-secondary education, limiting the growth of younger youth with only a high school diploma entering the labour market.
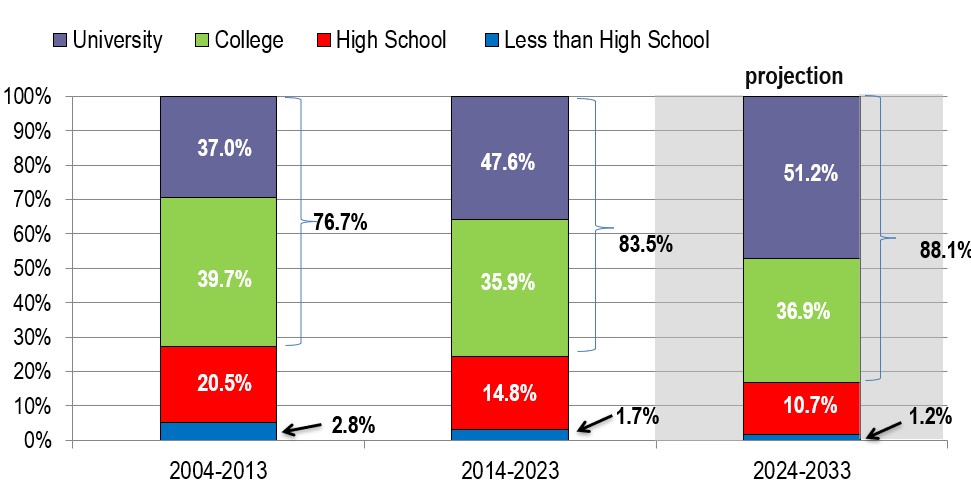
Figure 16 shows that the share of those with post-secondary education (PSE) in total school leavers is therefore projected to increase over the period 2024-2033.
Figure 16 : Historical and Projected Distribution of School Leavers by Education Level
Sources : Statistics Canada (historical data) and ESDC 2024 COPS projections.
Text version of Figure 16 : Historical and Projected Distribution of School Leavers by Education Level
As a result, the already high share of Canadian school leavers with PSE is expected to grow further over the projection period.
Indeed, school leavers with college and university education accounted for 83.5% of the total number of school leavers over the 2014-2023 period (3.99 million compared to 789 thousand for school leavers with lower educational attainment). This share is projected to increase to 88.1% (5.17 million school leavers with PSE) over the 2024-2033 period, driven by the large increase in the share of school leavers with college and university degrees.
Over the projection period, only 700 thousand school leavers are expected to enter the labour market without PSE. The number of school leavers with less than high school is expected to decreased from 83 thousand over the 2014-2023 period to 71 thousand over the period 2024-2033, representing only 1.2% of all school leavers over the projection period. Concurrently, the total number of those with only high school or some post-secondary education is projected to decline from 707 thousand over the 2014-2023 period to 629 thousand over the 2024-2033 period.
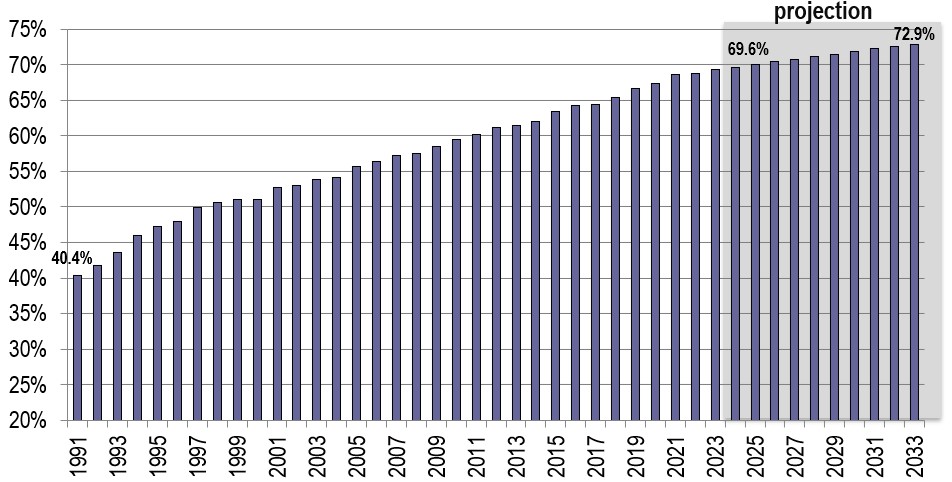
Figure 17 shows that the educational attainment of Canada’s labour force is expected to continue rising.
Figure 17 : Share of the Labour Force (15+) with a Post-secondary Education, 1991 - 2033
Sources : Statistics Canada (historical data) and ESDC 2024 COPS projections.
Text version of Figure 17 : Share of the Labour Force (15+) with a Post-secondary Education, 1991 - 2033
Therefore, the educational attainment of Canada’s labour force is expected to continue rising, with the share of the labour force with a PSE projected to increase to about 72.9% in 2033, from 69.3% in 2023. However, with the diminishing difference in the educational attainment between the older cohorts and the younger cohorts, the rise in the share of people with PSE is projected to be slower than the one registered during the previous ten years, when it grew by 7.8 percentage points, from 61.5% in 2013 to 69.3% in 2023.
More specifically, the projected growth in the labour force will be the highest among university graduates (2.7% average annual growth rate (AAGR) over the 2024-2033 period) and college graduates (AAGR of 0.6%).
With regards to the labour force participants without PSE, as their projected share of the labour force will decrease slightly, their overall number is expected to stagnate and begin to shrink. The size of the labour force represented by those with only a high school education is projected to grow at an annual average rate of just 0.2%, while the number of those with less than high school is projected to fall at an annual average rate of 0.8%.
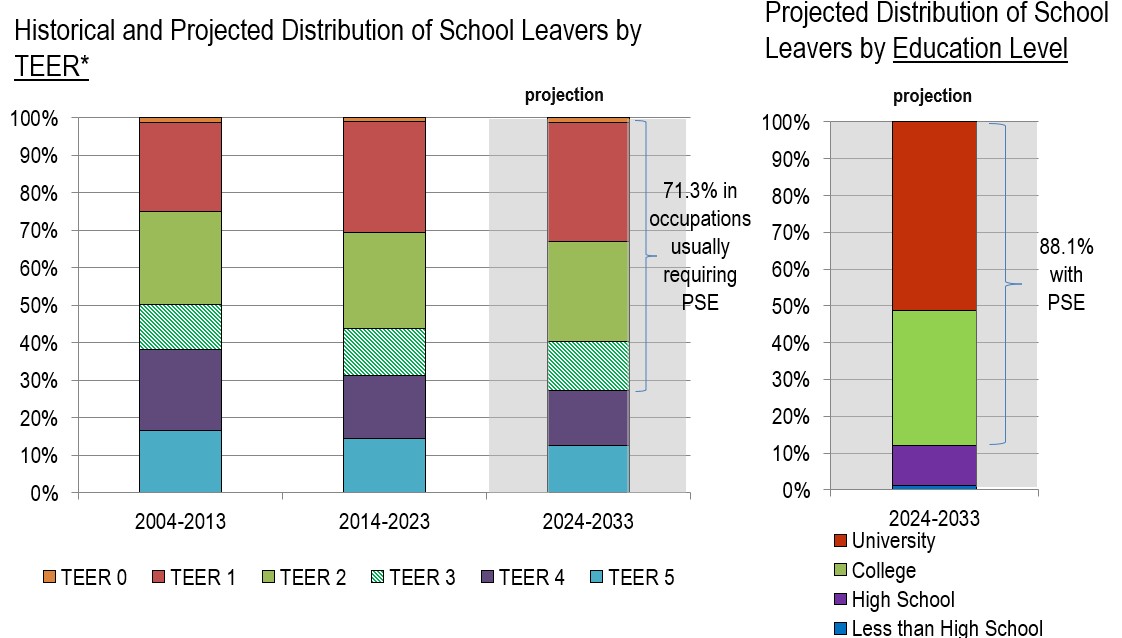
Figure 18 shows that not all the PSE school leavers are expected to work in occupations usually requiring PSE.
Figure 18 : Historical and Projected Distribution of School Leavers by TEER* and Projected Distribution of School Leavers by Education Level
Sources : Statistics Canada (historical data) and ESDC 2024 COPS projections.
*Based on NOC 2021.
Text version of Figure 18 : Historical and Projected Distribution of School Leavers by TEER* and Projected Distribution of School Leavers by Education Level
School leavers are estimated at their highest level of education attained and then distributed among occupations following the historical patterns of school leavers with the same level of education.
Although Canadian school leavers are projected to be more educated (88.1% with PSE), only 71.3% of them are expected to work in occupations that usually require PSE (TEER 1 to 3). This implies a relatively high incidence of education-occupation mismatch among recent PSE graduates as they leave school. In other words, a large proportion of school leavers with PSE enter the labour market to work in occupations that usually require lower levels of education (overqualified). This mismatch over the projection period represents an increase in comparison with the previous decade.
Part of this mismatch may be transitory as new school leavers need time to completely integrate into the labour force and into a matching occupation. They may land in lower skilled occupations when they first enter the labour market. Later, however, they might seek and move to occupations that better match their qualifications (note that this is taken into account in COPS by the inter-occupational mobility component).
Figure 19 shows that natural and applied sciences and related occupations are projected to experience the strongest school leavers rate.
Figure 19 : School leavers by Broad Occupational Category, Projection 2024-2033
Sources : Statistics Canada (historical data) and ESDC 2024 COPS projections.
Text version of Figure 19 : School leavers by Broad Occupational Category, Projection 2024-2033
Among the 10 broad occupational category, natural and applied sciences and related occupations occupations are expected to record the highest school leavers rate (as a % of 2023 employment), closely followed by health occupations and occupations in art, culture, recreation and sport. The occupational categories that are above average have higher proportion of occupations usually requiring post-secondary education. As for legislative and senior management occupations, very few workers transition directly to these occupations at the start of a career, as several years of work experience are usually required.
Job Seekers
New Immigrants
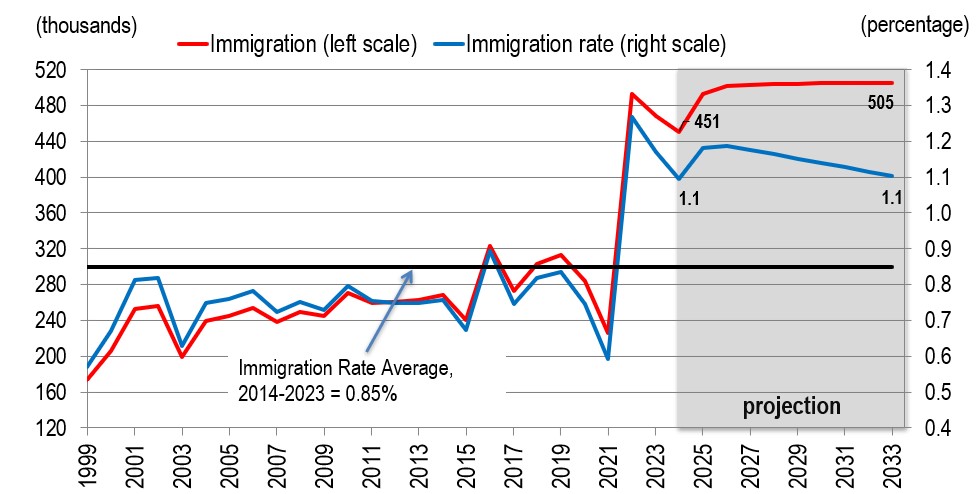
Figure 20 shows that in the projection, annual immigration is assumed to represent a relatively higher share of the population relative to past decades, based on the official immigration targets set by the Canadian Federal Government* for the next few years.
Figure 20 : Annual Immigration Level and Rate, 1999-2033
Sources : Statistics Canada (historical data) and ESDC 2024 COPS projections.
Text version of Figure 20 : Annual Immigration Level and Rate, 1999-2033
Between 2000 and 2021, the immigration rate averaged 7.4 per 1,000 people in Canada, or 0.74%, representing an average of 258,000 new immigrants entering Canada annually (from July to June each year). However, only a fraction of this total joined the labour market upon entering Canada, as this number includes children and adults who may or may not join the labour force. Indeed, new immigrants effectively entering the labour market averaged 136,600 every year over the same period.
Following a significant decline in the number of new immigrants during the pandemic, the Federal Government set new immigration targets to welcome a significantly larger number of immigrants than in the past. This new target is expected to lead to an immigration annual average rate of about 1.1% over the projection period. As a result, about 5 million new immigrants are expected to join the Canadian population over the 10-year projection period under this projection scenario.
Figure 21 shows that projected immigration will account for a larger share of population growth than observed in the previous decade.
Figure 21 : Population Growth by Demographic Component, Annual Averages
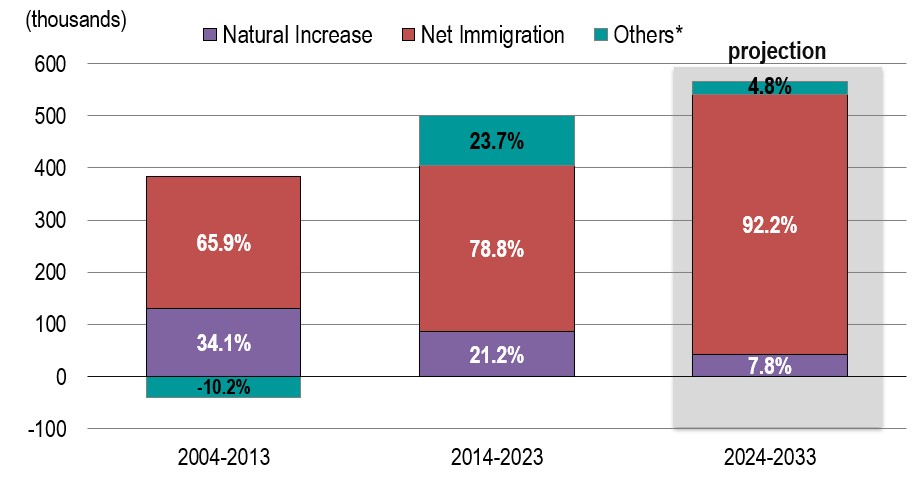
*Others include net change in non-permanent residents and emigrants.
Sources : Statistics Canada (historical data) and ESDC 2024 COPS projections.
Text version of Figure 21 : Population Growth by Demographic Component, Annual Averages
In the projection, annual population growth averages about 566 thousand per year over the 2024-2033 period, compared to 501 thousand over the previous 10-year period.
The share of population growth stemming from immigration is expected to increase to 92% over the 2024-2033 period, compared with 79% for the period 2014-2023 and 66% for the period 2004-2013. This is due both to an increase in net immigration itself and a slower natural population increase (births minus deaths).
Concerning the net change in non-permanent residents, the projection assumes a net increase of about 587,000 in 2024 followed by a much more modest net increase of 92,000 in 2025. The number of non-permanent residents is then projected to remain relatively stable for the subsequent years included in the projection period (almost zero growth).
It is important to remember that these projections were developed before the Federal Government reduced the target of temporary residents to 5% of the total population by the end of 2026.
Figure 22 shows that immigration is expected to account for a much larger share of labour force growth over the projection period, compared to the previous 20 years.
Figure 22 : Contribution of New Immigrants to Total Labour Force Growth: Annual Averages
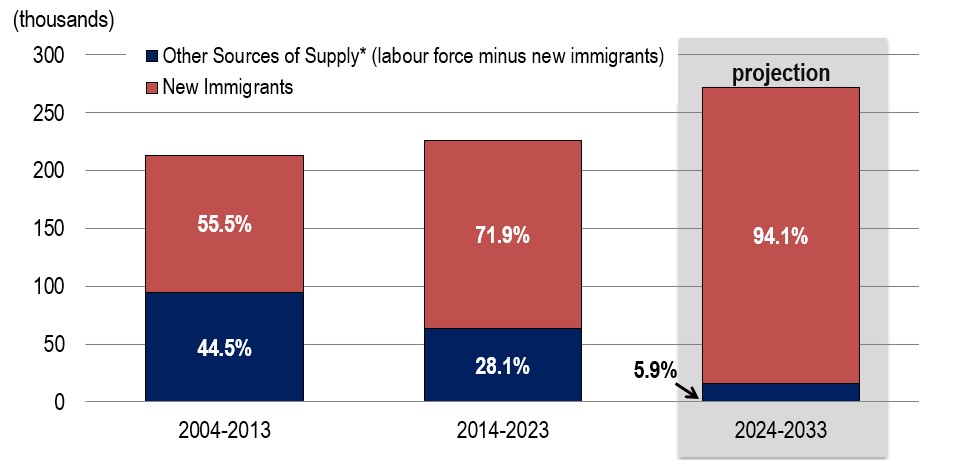
*Others include net change in non-permanent residents and emigrants.
Sources : Statistics Canada (historical data) and ESDC 2024 COPS projections.
Text version of Figure 22 : Contribution of New Immigrants to Total Labour Force Growth : Annual Averages
The projections show an increase in the net growth of the labour force over the projection period. This is a consequence of a large projected increase in immigration in comparison to the historical period. In turn, this will help compensating for the demographic pressures on the labour force arising from the current wave of baby-boomers entering retirement.
Without immigration, there would be little or no growth in the Canadian labour force over the next decade. Because of the slowdown in the domestic sources of growth, new immigrants are anticipated to represent about 94% of the annual average net growth of the labour force over the projection period, up from 72% during the previous 10 years. In fact, starting in 2026, immigration is projected to account for 100% of the net growth in the labour force.
Although immigration is the primary source of net growth in the labour force, it is not expected to be the main source of new labour market entrants in Canada. School leavers will remain as the main source of new job seekers (see slide 45).
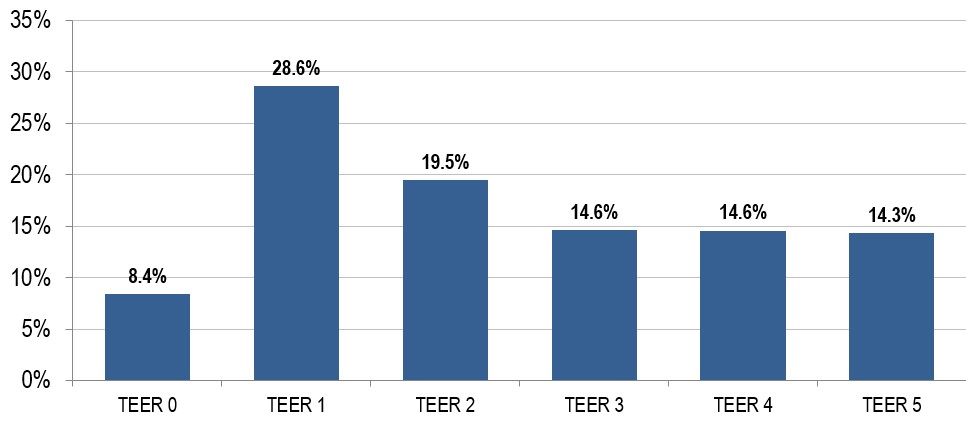
Figure 23 shows that it is expected that almost two-thirds of new immigrants entering the labour market will seek employment in occupations that usually requires post-secondary education (TEERs 1 to 3).
Figure 23 : Distribution of New Immigrants Joining the Labour Market, by TEER Category, 2024-2033
Sources : Statistics Canada (historical data) and ESDC 2024 COPS projections.
Text version of Figure 23 : Distribution of New Immigrants Joining the Labour Market, by TEER Category, 2024-2033
Almost 30% of immigrants are expected to seek employment in occupations usually requiring a university degree; and another 25% in occupations that usually require a college diploma or apprenticeship training of two or more years, or supervisory occupations. Equal shares of about 14% to 15% will seek employment in TEERs 3 to 5 occupations, and a little more than 8% of them will seek it in management occupations.
Figure 24 shows that natural and applied sciences and related occupations are projected to experience the strongest immigrations rates.
Figure 24 : Immigration Rate by Broad Occupational Category, 2024-2033
(New immigrants entering the labour market as a % of 2023 employment)
Sources : Statistics Canada (historical data) and ESDC 2024 COPS projections.
Text version of Figure 24 : Immigration Rate by Broad Occupational Category, 2024-2033
Among the 10 broad occupational category, natural and applied sciences and related occupations occupations are expected to record the highest immigration rate (as a % of 2023 employment), followed by occupations in manufacturing and utilities; sales and services occupations; and business, finance and administration occupations.
It is expected that natural and applied science occupations will account for about one-quarter of all new immigrant job seekers, particularly in computer and information systems professionals; and computer, software and web designers and developers.
Job Seekers
Occupational Mobility or Occupational Movers
The COPS projections consider two types of occupational mobility :
Vertical Mobility : workers who move into occupations outside their current skill level. Two are considered:
- Upward mobility : workers who have gained working experience move to higher skilled occupations or management positions.
- Downward mobility : workers who choose to enter lower-skilled occupations, sometimes as part of their transition towards retirement or driven by higher salaries, for instance engineers leaving their occupations to become supervisors in the oil and gas sector.
Horizontal Mobility : workers who move into occupations within the same skill level (i.e. occupations that usually require the same level of education).
New inflows do not represent all the sources of labour in occupations. In many instances, workers from other occupations represent an important source of hiring. Occupations loose existing workers but also gain workers from other occupations. The difference between the number of workers entering and the number of workers leaving a given occupation is called net occupational mobility. In this COPS projections, the term mobility always refers to net mobility in an occupation (or a TEER category). In order to project future net mobility, observed past inter-occupational mobility patterns are used in conjunction with the estimated projected occupational labour demand to determine career paths that workers may follow over the projection period.
Figure 25 shows that management occupations are projected to have the largest net inflow of workers from other occupations, while occupations usually requiring university education are expected to have the largest net outflow of workers. They are closely followed by occupations usually require short-term work demonstration and no formal education.
Figure 25 : Projected Number of Workers Moving Between TEER categories, 2024-2033
(in thousands and as a percentage share of 2023 employment)
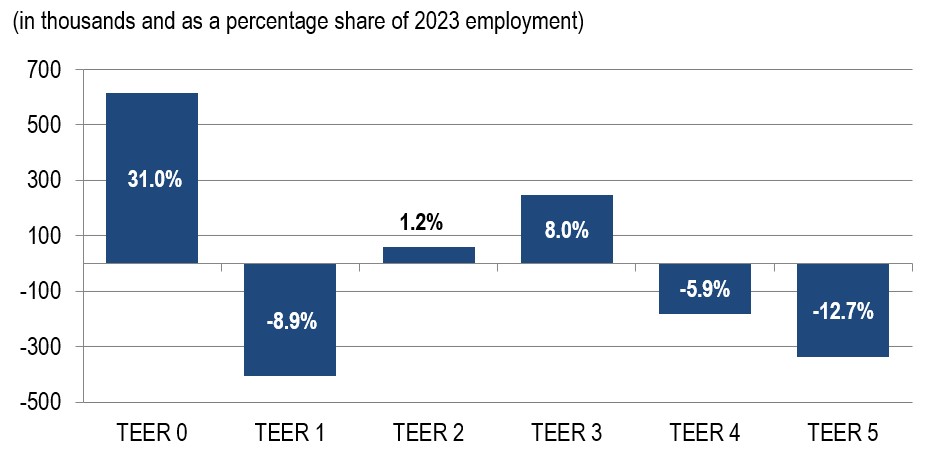
Sources : Statistics Canada (historical data) and ESDC 2024 COPS projections.
Text version of Figure 25 : Projected Number of Workers Moving Between TEER categories, 2024-2033
Management occupations have the largest relative mobility inflows among all TEERs, as many experienced workers from other TEERs will seek jobs in management positions left vacant mainly due to retirements. Over the 2024-2033 period, about 615,700 new managers are expected to come from occupations in other TEER levels, mostly from occupations typically requiring university education. Moreover, mobility is the main source of supply for managers. Over the coming decade, more workers are expected to go up the TEER ladder to become a manager than established managers leaving for a non-managerial occupation.
For those working in occupations requiring university education, net mobility is expected to be negative (-404,500). Workers in this TEER are the main source of labour for managerial occupations. Net mobility in occupations requiring college education (TEERs 2 and 3) is expected to be positive (+305,900). Many workers with a college degree start working in an occupation that only requires high-school or on-the-job training, before seeking work in a new position. This is also reflected by about 517,200 workers expected to move up from these occupations that do not require PSE education in the coming decade.
Figure 26 shows that legislative and senior management occupations are projected to have the largest net inflow of workers from other occupations, while natural and applied sciences and related occupations are expected to have the largest net outflow of workers.
Figure 26 : Projected Number of Workers Moving Between TEER categories, 2024-2033
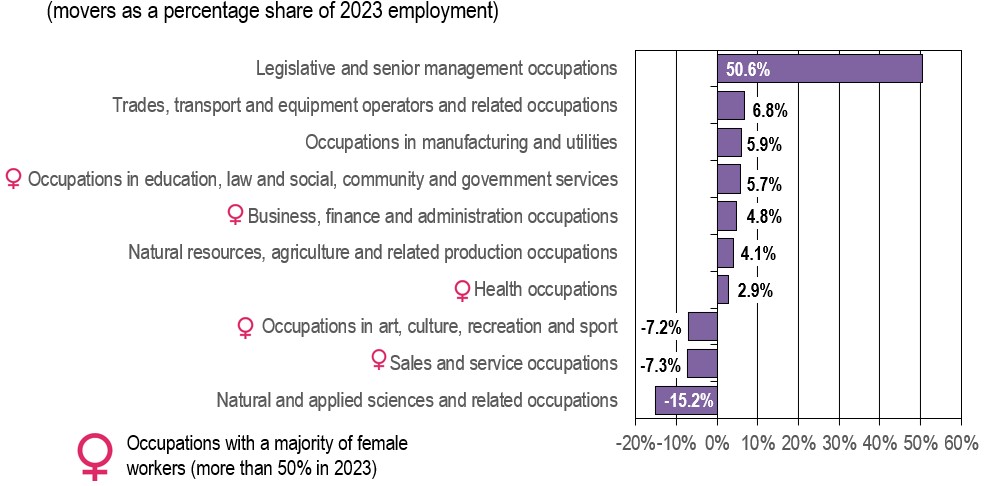
Sources : Statistics Canada (historical data) and ESDC 2024 COPS projections.
Text version of Figure 26 : Projected Number of Workers Moving Between Broad Occupational Category, 2024-2033
At the broad occupational category, legislative and senior management occupations have the largest relative mobility inflows, as many experienced workers from other occupational categories will seek to fill positions left vacant mainly due to retirement. Over the 2024-2033 period, about 65,400 new legislative and senior managers are expected to come from occupations in other broad categories. Moreover, mobility is the main source of supply for these occupations.
On the other hand, natural and applied sciences and related occupations are the occupational category that is expected to have the largest net outflows of workers. Most of these occupations require university education and experienced workers tend to be mobile and seek jobs in other fields.
Total Job Seekers
Figure 27 shows that while new immigrants will contribute more to the pool of job seekers, school leavers will remain the primary source over the projection period.
Figure 27 : Sources of New Job Seekers
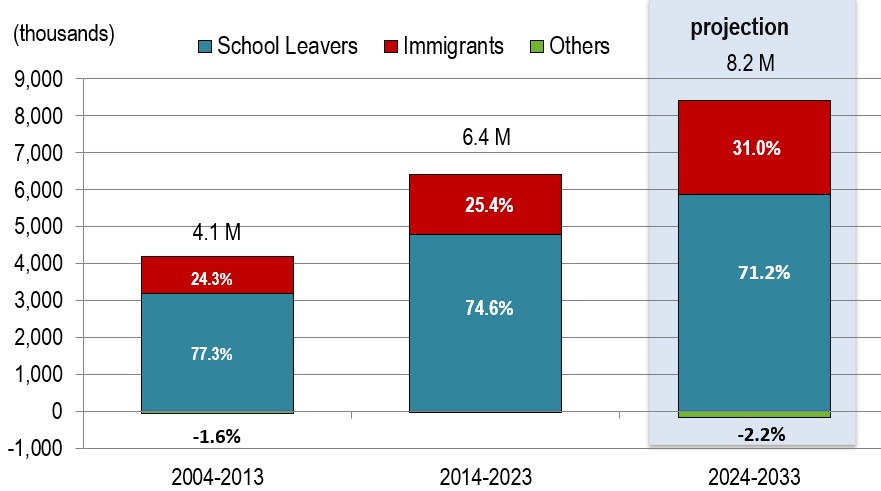
Sources : Statistics Canada (historical data) and ESDC 2024 COPS projections.
Text version of Figure 27 : Sources of New Job Seekers
Even though new immigrants are expected to account for the majority of the net growth in the labour force over the next decade (see figure 20), they will still represent a relatively small share of the total number of people who enter the Canadian labour market each year.
In fact, the number of young people coming out of Canada’s education system (with or without any certificate, high school, or a post-secondary diploma), the so-called school leavers, is much larger than the number of new immigrants :
- over the 2014-2023 period, approximately 162,400 new immigrants and 478,000 school leavers were estimated to have entered the labour market yearly;
- over the projection period, an average of approximately 255,000 new immigrants are expected to enter the labour market every year, compared with approximately 587,000 new seekers coming from the education system;
- in the last decade, the ratio of the number of school leavers to that of new immigrants was about 2.9, compared to 2.3 over the projection period.
Hence, as the Canadian education system is expected to remain the primary source of new job seekers for the labour market, it will be important to ensure that the qualifications of these job seekers properly reflect the labour market needs.
Note : In the chart, the category “Others” includes a series of small components capturing labour market inflows and outflows such as those returning to school, labour market returns, and students that seek work while being registered in education programs. The total volume of job seekers will be reduced by about 179 thousand seekers (employed and unemployed) dropping out of the labour market due to discouragement or retirement of jobless workers.
Figure 28 shows that about three-quarters of all job seekers are expected to look for work in occupations usually requiring post-secondary education (PSE), or in management occupations (TEERs 0 to 3).
Figure 28 : Job Seekers by TEER Category, 2024-2033
Sources : Statistics Canada (historical data) and ESDC 2024 COPS projections.
Text version of Figure 28 : Job Seekers by TEER Category, 2024-2033
COPS projects a total of 8.2 million job seekers (from the school system, immigration and other sources) to enter the labour market over the projection period.
About three-quarters (77.2% - around 6.36 million individuals) of these entrants are anticipated to be in occupations that usually require postsecondary education (university, college or vocational) or in management occupations. At a more detailed level :
- About 71% of new immigrants are expected to pursue work in occupations generally requiring postsecondary education or in management positions;
- Upward occupational mobility is also expected to add job seekers for management occupations and those requiring college education. This upward mobility is mainly the result of previously mismatched skilled workers seeking work in occupations that better match their skills as well as promotion into management ranks.
About a quarter of job seekers (around 1.88 million) are expected to look for work in occupations requiring only high school education or no formal education.
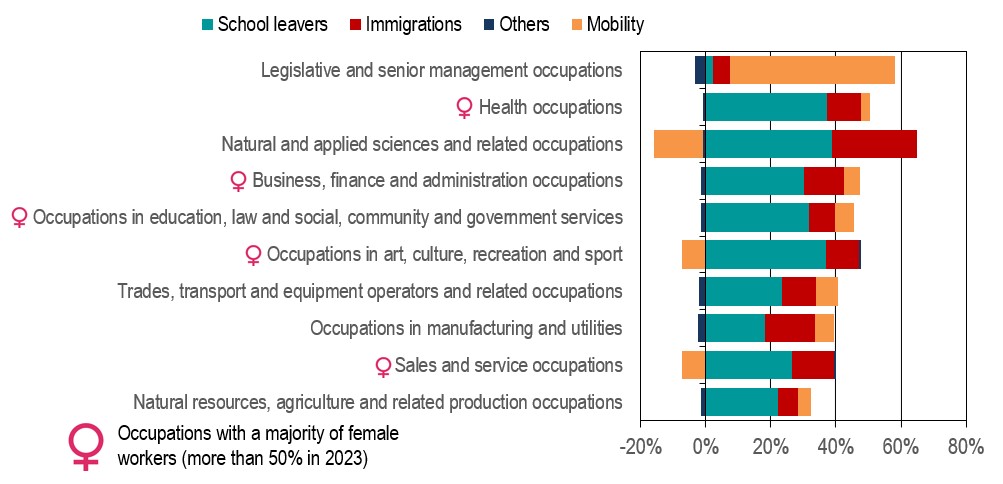
Figure 29 shows that legislative and senior management, as well as health occupations are projected to experience the highest job seeker rate.
Figure 29 : Job Seeker Rate by Broad Occupational Category, Projection 2024-2033
(Job seekers as a % of 2023 employment, in percentage)
Sources : ESDC 2024 COPS industrial projections.
Text version of Figure 29 : Job Seeker Rate by Broad Occupational Category, Projection 2024-2033
Among the 10 broad occupational category, legislative and senior management, as well as health and natural and applied science occupations are expected to have the highest job seekers rate.
- In the case of legislative and senior management occupations, a strong positive mobility is expected to account for the vast majority of job seekers.
- Due to the highly specialized skills required among health-related occupations, net mobility is expected to contribute only marginally.
School leavers represent the largest source of job seekers for all the other occupational groups, especially among health; natural and applied sciences; as well as arts, culture, recreation and sports occupations (see figure 17).
- Natural and applied sciences occupations are expected to have the largest immigration rate (see figure 22) and a large contribution to job seekers;
- On the other hand, occupations related to health, as well as to arts, culture, recreation and sports are projected to have below average immigration rates, contributing, very little to their new pool of workers;
- Strong negative mobility is expected to reduce the number of job seekers for natural and applied sciences (see figure 24); as well as for arts, culture, recreation and sport occupations.
Imbalances
The process of identifying occupations potentially facing risks of shortages or surpluses consists of 3 steps.
Step 1 : Recent labour market conditions (2021-2023): COPS assesses the initial labour market conditions (shortage or surplus) for 485 of the 516 NOC existing occupations over the 2021-2023 period. The methodology relies on the analysis of about 30 labour market indicators (e.g. unemployment rate, employment growth, job vacancies growth and duration, proportion of overtime workers and Employment insurance (EI) recipients, etc.). Imbalances (shortages or surplus) are identified when indicators diverge significantly from the average for all occupations and/or their own historical norms.
Step 2 : Projected flows of job openings and job seekers (2024-2033): COPS projects the flows of new job openings (labour demand from job creation and replacement needs due to retirements, in-service deaths, or emigration) and new job seekers (labour market entrants from the school system, immigrants, re-entrants into the labour market, and workers switching occupation) over the projection period.
Step 3 : Future labour market conditions (by 2033): Future labour market conditions are determined by combining Step 1 (recent labour market conditions) and Step 2 (projected flows of job seekers and job openings). Step 1 is used as a starting point, and Step 2 is used to assess whether the conditions identified in Step 1 will persist through or change during the projection period.
Example of an occupation projected to face shortage conditions :
General practitioners and family physicians (NOC 31102)

Sources : ESDC 2024 COPS projections.
Text version of Figure 30 : General practitioners and family physicians (NOC 31102)
General practitioners and family physicians (NOC 31102) is used to show an example of how COPS combines the results from the recent labour market conditions (step 1) with the projected flows (step 2) in order to determine the future shortage conditions and final outlook (step 3).
Step 1 : Recent labour market conditions (2021-2023)
The occupation showed strong signs of shortage in recent years. Indeed, the analysis of key labour market indicators, including job vacancies, employment growth, and the unemployment rate suggests that labour demand substantially exceeded labour supply in this occupation over the 2021-2023 period.
Step 2 : Projected flows of job openings and new job seekers (2024-2033)
COPS projects the flows of job openings from job creation and replacement needs and new job seekers over the projection period.
Over the period 2024-2033, the number of job openings for General practitioners and family physicians is expected to total 47,800, which substantially exceeded the number of job seekers (25,800).
Projected job openings (2024-2033)
Over the period 2024-2033, a total of 47,800 job openings are projected, resulting from both job creation (expansion demand) and replacement demand (retirements, in-service deaths, or emigration).
- Job creation is expected to account for approximately 56% of job openings, a higher proportion than the average for all occupations (around 32% of job openings).
- Replacement demand is expected to account for about 44% of job openings.
Projected job seekers (2024-2033)
Over the period 2024-2033, a total of 25,800 job seekers arising from school leavers, immigrants, re-entrants into the labour market, and those changing occupations are expected, equivalent to an average of 2,580 job seekers per year. This represents around 3.4% of the 2023 employment level (76,000 workers) annually.
- School leavers are expected to be the main source of job seekers, followed by new immigrants.
- Finally, mobility is expected to be slightly negative for this occupation as the number of workers departing for other occupations exceeds the number of workers coming in the occupation.
Step 3 : Future labour market conditions (by 2033)
Because the occupation was showing strong signs of shortage conditions in the recent years (step 1), and the projected flow of job openings is expected to substantially exceed the projected flow of job seekers (step 2), the occupation is expected to face a strong risk of shortage during the projection period (step 3).
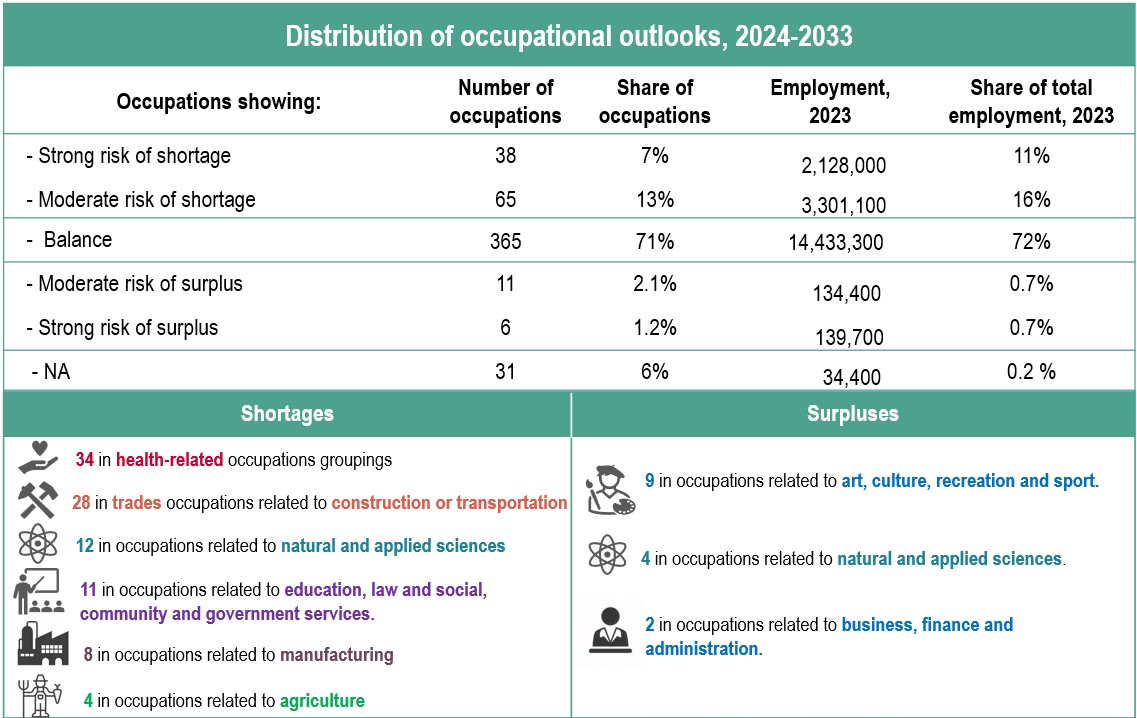
Final outlook summary
Sources : ESDC 2024 COPS projections using ESDC and Statistics Canada data.
Text version of Figure 31 : Final outlook summary
The final assessment shows that 38 occupations are expected to face strong risk of shortages, 65 to face moderate risk and 365 to be likely in balance. On the other hand, 6 occupations are projected to face strong risk of surplus and 11 to face a moderate risk. Finally, 31 occupations were not assessed.
Overall, about 20% of the 516 occupations are expected to present risk of shortage while only 3% to face a risk of surplus. Occupations expected to present risk of shortages are larger as they represent 27% of total employment in 2023, while those expected to present risk of surplus only accounted for 1.4% of total employment in 2023.
Of the 103 occupations expected to present strong or moderate risk of shortage, 34 are health-related occupations (22 strong and 12 moderate), 28 are occupations related to construction trades or transportation (4 strong and 24 moderate).
Another 12 are among natural and applied science occupations (all moderate), 11 related to education, law and social, community and government services (4 strong and 7 moderate), 8 in occupations related to manufacturing (5 strong and 3 moderate) and 4 in occupations related to agriculture (3 strong and 1 moderate). There are also 4 with moderate risk of shortage related to the sales and service, one occupation related to the oil and gas sector and one to the mining sector.
On the other hand, 9 of the occupations expected to face risk of surplus are related to arts, culture, recreation and sport (3 strong and 6 moderate). Another 4 are related to natural and applied science (3 strong and 1 moderate), while 2 occupations related to business, finance and administration are expected to face moderate risk of surpluses.
63100 Insurance agents and brokers; 63200 Cooks; 63201 Butchers - retail and wholesale; 64401 Postal services representatives;
Source : ESDC 2024 COPS Projections.
Bold : Occupations expected to face strong risks of shortage conditions (2024-2033).
Source : ESDC 2024 COPS Projections.
Bold : Occupations expected to face strong risks of surplus conditions (2024-2033).