Canadian Occupational Projection System (COPS)
Job Openings (2022-2031)
NOTE: The current COPS projections were completed in spring 2022, i.e. before expectations about the risk of an eventual recession in 2023. However, the focus of the COPS projections is on long-term trends in industrial and occupational labour markets, not on short-term developments. These long-term trends are not expected to be affected markedly by an eventual recession as its impacts are expected to be temporary and of short duration.
Note also that the 2022 COPS exercise was developed using the 2016 version of the National Occupational Classification (NOC).
The 2016 NOC has 500 occupations. However, many of these occupations are small in terms of employment. Such occupations were combined into broader groupings according to the specific tasks of each occupation. By grouping small occupations with similar tasks together, 293 occupational groupings were obtained.
Although NOC already has a more recent version (2021), the model’s input data were only available in the 2016 version of the NOC at the time of the development of the projections.
For more information on the 293 occupational grouping used in COPS, please visit the COPS Occupational Groupings' Definition.
Job openings are comprised of two primary components: expansion and replacement demand:
- Expansion demand corresponds to the job creation generated by economic growth. It can be understood as "required employment" - that is, the number of people required to reach a certain level of production, given a specific level of productivity.
- Replacement demand corresponds to any existing jobs which have been vacated due to retirements, deaths and emigration.
Job Openings due to Economic Growth (Expansion Demand or Employment Growth)
Over the next 10 years, economic growth is expected to generate about 2.8 million new jobs (284,000 on average every year), which represent an annual average growth rate of 1.4%. In the long term, job creation will become increasingly constrained by the slower pace of growth anticipated in the labour force (see the document Macroeconomic Outlook).
Occupational employment is driven by the degree to which the various occupations are utilized in each industry (occupational effect) and by the economic growth of the industries that employ them (industrial effect).
The occupational effect impacts occupational employment via the productivity and utilization levels of each of the occupations in the economy encompassed by technological advances. This effect sometimes leads to job losses in some occupations, but also to job growth in some others or even the creation of new occupations.
In recent years, there has been an increasing interest in better understanding how technological progress will impact the labour market, as the automation of the production process and the stronger introduction of Artificial Intelligence (AI) are expected to accelerate, considering the speed of technological developments. In general, these two developments affect employment in two different ways. By displacing workers from tasks they were previously performing, labour market disruptions occur over the transition period. But eventually, the increase in real wages resulting from higher productivity leads to the creation of new jobs to produce the goods and services that people want to buy with their extra income.
Historical evidence suggests that technology has ended up creating more jobs than it has destroyed, as jobs have been reallocated at the industrial and occupational levels. For example, the Canadian economy has evolved from agriculture to manufacturing to services over the past century.
Most experts agree that automation is not expected to destroy a large number of jobs over the next 10-20 years, as specific tasks rather than entire occupations are most likely to be automated. This process is expected to be concentrated on occupations with a high content of repetitive and routine tasks, which are at a higher risk to be at least partially automated. Most of these occupations tend to require low levels of education and are concentrated in the lower range of the pay scale. For instance, the introduction of computers sped up some aspects of jobs, enabling workers to do the other tasks better. Rather than destroying occupations, computers redefined them. But this process required workers to learn new skills.
Recent literature on the impact of AI indicates that a broader range of occupations could potentially be impacted by its spread, including those involving non-routine, cognitive and interpersonal tasks. The AI’s interactivity, adaptability and processing capabilities could now impact occupations that were first thought to be more immune to the technological shock. For example, some forms of AI can now write reports using advance language proficiency or improve costumer support services by providing workers with accurate simple language to better respond to costumers needs. However, some experts argue that AI would continue being complementary to workers and might even have an equity positive impact, as low- and middle-skilled workers might see relatively larger gains in the work performance when AI is part of their tools to work than among high-skilled workers (Noy and Zang, 2023; as well as Brynjolfsson et al, 2023).
Figure 1 shows employment growth by type of task over the period 2011-2031. It shows that over the next decade, occupations with a high content of routine and interpersonal tasks were more severely impacted by the pandemic, but all three types of tasks could potentially be impacted by technological changes, largely driven by stronger utilization of AI.
Figure 1: Employment Growth by Type of Task (Indexed Growth; 2019=100)
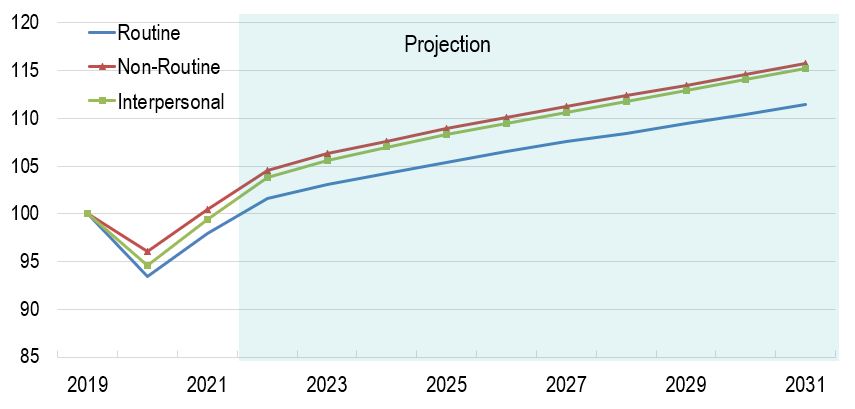
Source: ESDC 2022 COPS Projections.
Text version of Figure 1: Employment Growth by Type of Task (Indexed Growth; 2019=100)
This figure shows that during the first half of the 2010s occupations with a high content of routine tasks had weaker employment growth, large due to the implementation increase of automation. More recently, occupations with a high content of routine and interpersonal tasks were more severely impacted during the pandemic, due mostly to the restrictions imposed on businesses that characterised by close contact and high degree of in-person interaction. As AI becomes a bigger part of the technological progress, its impact is expected to be more evenly spread out among all occupations, regardless of their tasks concentration.
The industrial effect influences occupational employment growth according to the performance of the industry where they are employed. In principle, occupations directly linked to industries that are expected to have strong employment growth will benefit from a positive outlook. The reverse occurs for occupations linked to industries with weak employment growth.
Employment growth by industry reflects the future trends anticipated in production and labour productivity for each of the 42 industries covered by COPS.
Figure 2 shows the industries that are projected to post the strongest growth in employment over the projection period. In principle, occupations directly linked to industries that are expected to have strong employment growth will benefit from this positive outlook. The reverse occurs for those tied to industries with weak employment growth.
Figure 2: Industries Projected to Have the Strongest Employment Growth, Projection 2022-2031 (average annual growth, in percentage)
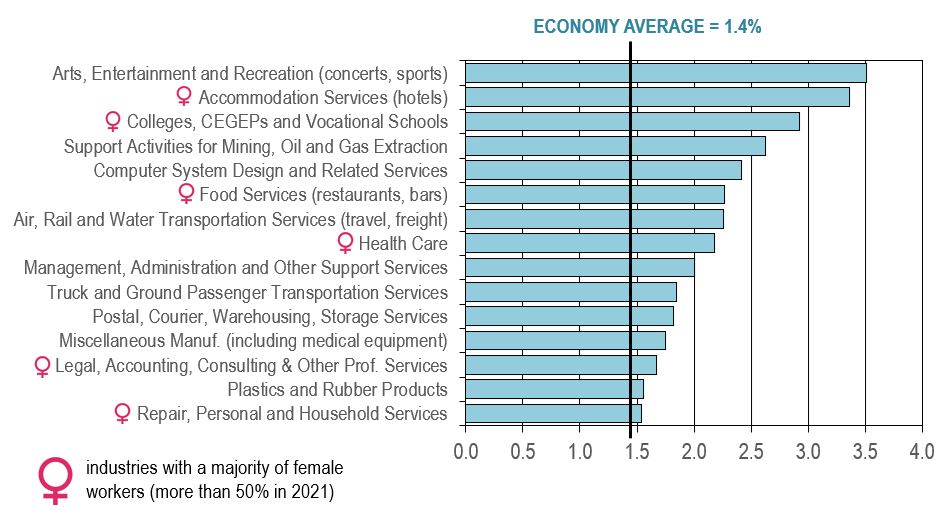
Source: ESDC 2022 COPS industrial projections.
Text version of Figure 2: Industries Projected to Have the Strongest Employment Growth, Projection 2022-2031 (average annual growth, in percentage)
Industries projected to experience the strongest growth in employment (i.e. above 1.5% annually) are also those projected to experience among the strongest growth in output or those that are characterized by a high degree of labour intensity and human-centric jobs (low productivity growth). Below are some of the key factors expected to support output and job creation in those industries:
- The accumulation of a large amount of pent-up demand for hard-to-distance services during the pandemic: arts, entertainment and recreation (concerts, theaters, museums, casinos, sport events, gyms); hotels, restaurants and bars; travel and tourism; personal and household services.
- The return of foreign students to Canada and the positive impacts of domestic demographics on enrollment rates in colleges, CEGEPs and vocational schools.
- Renewed growth in support activities for mining/oil/gas (such as drilling and exploration) in response to higher oil prices (short-term) and to the federal government’s critical mineral strategy (long-term).
- Rapid innovations in information and communication technologies (ICT) and the need for businesses to continuously upgrade their ICT infrastructure to remain secure and competitive (computer systems).
- Strong demand for health care, stimulated by population aging, the recovery from the backlog in “non-essential” treatments caused by the pandemic, and the universal dental care program.
- The growing number of firms across the economy that choose to outsource administrative and support functions in order to remain focused on their core activities and increase operation efficiency.
- The faster pace of growth anticipated in manufacturing shipments (truck transportation) and additional investment in public and urban transit systems (ground passenger transportation).
- Continued growth in e-commerce and the associated demand for postal, courier, warehousing and storage services (although a large part of the unfulfilled demand took place during the pandemic).
- Increased demand for skilled workers in the design and production of medical equipment and the positive impact of the acceleration projected in manufacturing activity on plastics and rubber products.
- Growing demand for professional advice on planning, logistics, mergers, acquisitions, environmental regulation and implementation of new technologies (legal, accounting and consulting services).
Figure 3 shows the industries that are projected to post moderate growth in employment over the projection period.
Figure 3: Industries Projected to Have Moderate Employment Growth, Projection 2022-2031 (average annual growth, in percentage)
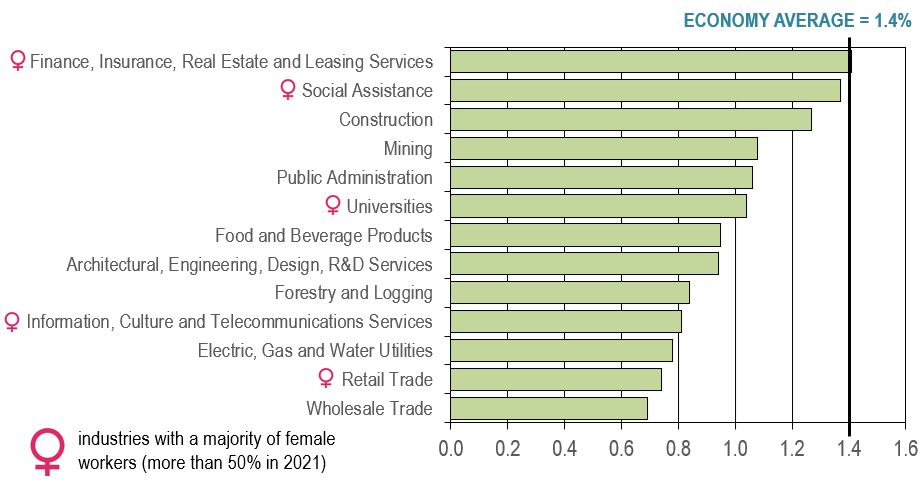
Source: ESDC 2022 COPS industrial projections.
Text version of Figure 3: Industries Projected to Have Moderate Employment Growth, Projection 2022-2031 (average annual growth, in percentage)
Industries projected to experience moderate growth in employment (i.e. between 0.7% and 1.4% annually) are also among those projected to experience moderate growth in output and/or those where productivity growth is expected to account for a significant part of real GDP growth.
This group includes several industries that performed relatively well in terms of output and employment growth during the pandemic, such as finance, insurance and real estate; construction; public administration; information, culture and telecommunications services; retail trade; and wholesale trade. Such industries benefited from a booming housing market; the development and implementation by public servants of various government pandemic-related support programs; a more intensive use of telework and streaming services by businesses and households; and a shift in consumption patterns toward goods and online shopping.
However, those industries are projected to grow at a more moderate pace, on average, over the next decade. Indeed, lower purchasing power resulting from high inflation along with rising interest and mortgage rates and large government deficits are some of the key factors expected to affect growth in consumer spending (notably for goods), residential investment and government expenditures, particularly in the short- to medium-term.
For most industries listed on the chart, moderate output growth is expected to limit employment growth. Relevant examples are forestry, public administration, mining and construction which are projected to experience the weakest growth rates in output among the group.
In many other industries, productivity growth is expected to account for a significant share of the modest pace of growth anticipated in output, restraining employment growth further, particularly in industries providing commercial services (such as wholesale and retail trade; information, culture and telecommunication services; and finance, insurance and real estate) or non-commercial services (e.g. universities and social assistance). This situation reflects increased automation and rapid advances in digital and cognitive technologies. It also reflects new ways of delivering services and replace labour by capital wherever possible in response to demographic pressures on labour supply in Canada.
Figure 4 shows the industries that are projected to post the weakest growth or declines in employment over the projection period.
Figure 4: Industries Projected to Have the Weakest Growth or Declines in Employment, Projection 2022-2031 (average annual growth, in percentage)

Source: ESDC 2022 COPS industrial projections.
Text version of Figure 4: Industries Projected to Have the Weakest Growth or Declines in Employment, Projection 2022-2031 (average annual growth, in percentage)
Industries projected to experience the weakest growth or declines in employment (i.e. below 0.6% annually) are also those projected to experience among the weakest growth in output and/or those where productivity growth is expected to account for a large part (or the totality) of real GDP growth.
This group is essentially composed of manufacturing and primary industries, with the exception of elementary and secondary schools. Many of those industries have experienced a stagnation or a declining trend in output and/or employment over the past several years, such as agriculture, printing, textiles, clothing, furniture, wood products, paper and fishing. This group of industries is expected to face similar challenges than those experienced in the past as well as new challenges, including:
- The intensification of foreign competition from low cost-producers in the manufacturing sector;
- Lower demand for paper and printing due to the growing use of electronic media and telework;
- Limited demand for wood, bricks, windows, furniture, appliances and other manufactured products due to the gradual slowdown projected in residential investment in North America;
- Timber and fish supply constraints (allowable annual cuts and various quotas on fish species);
- Difficulties to attract workers in agriculture and out-migration from rural/fishing communities;
- Environmental regulation and limited production and pipeline capacity in oil and gas extraction.
Productivity growth is expected to account for a large share (or the totality) of output growth in most industries listed on the chart, restraining employment growth (or resulting in employment declines) over the projection period. This reflects the fact that employment in those industries is largely composed of routine tasks that can be increasingly automated with new applications enabled by technological progress. The solid pace of growth anticipated in investment related to machinery and equipment (M&E) is expected to increase the amount of capital and technology available per worker, boosting productivity. For example, advanced robotics, augmented reality, 3D printing and internet of things (IoT) are among the most innovative technologies that are expected to transform manufacturing operations and improve productivity over the forecast horizon. Significant job losses in oil and gas extraction reflects the fact that the exploitation of oil sands has become less labour intensive due to advancements in extractive technologies and modular facility design. Additional job losses in fishing and paper primarily reflects further declines in output.
For more details on the historical and future performance of the 42 industries covered by COPS, including key drivers of GDP, employment and productivity growth, please consult the Industrial Summaries available on the COPS website.
Figure 5 shows the change in average annual employment by usual educational requirements over the periods 2002-2011, 2012-2021 and 2022-2031. It shows that over the next ten years, new job openings arising from economic growth are projected to be mainly in management positions and in those that usually require post-secondary education.
Figure 5: Average Annual Employment Change by Usual Educational Requirements
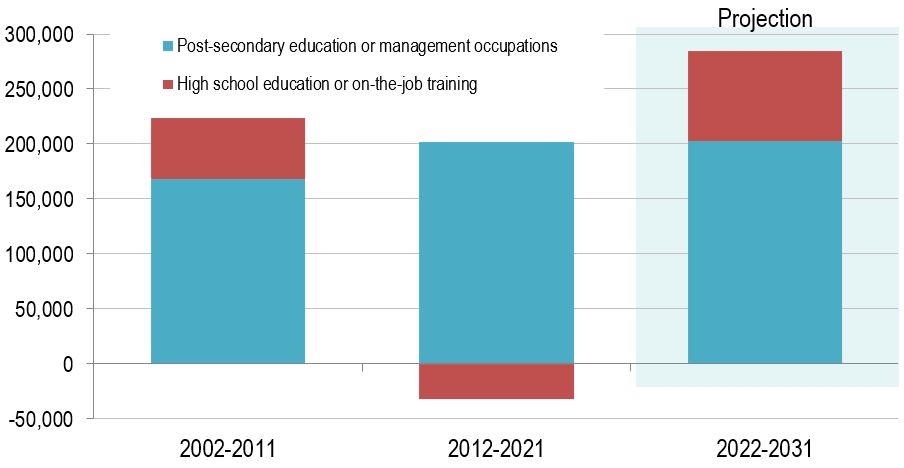
The shaded area represents the projection period.
Source: Statistics Canada (historical) and ESDC 2022 COPS Projections
Text version of Figure 5: Average Annual Employment Change by Usual Educational Requirements
About 71% of the projected employment growth over the next 10 years is expected to be in occupations that usually require post-secondary education (university, college or vocational) or in management occupations. As a comparison, those occupations accounted for all new job creation during the preceding decade, as employment in occupations usually requiring high school education or on-the-job training was significantly impacted during the pandemic and had not fully recovered by 2021. However, the projected trend for the next decade is a continuation of what has been observed over the past 20 years as the Canadian economy became more knowledge-intensive, automatized and with stronger health care needs. Occupations that usually require post-secondary education (university, college or vocational) or in management occupations accounted for 65.7% of total employment in 2021.
The demand for jobs in occupations usually requiring high school education or on-the-job training is also projected to grow, but at a lower rate. The expected demand in health and its assisting occupations; and the continuing recovery of sectors that were highly impacted by the pandemic like accommodation and food services; art, entertainment and recreation; and tourism related services, will support employment growth in occupations usually requiring high school education or on-the-job training that are concentrated in these industries.
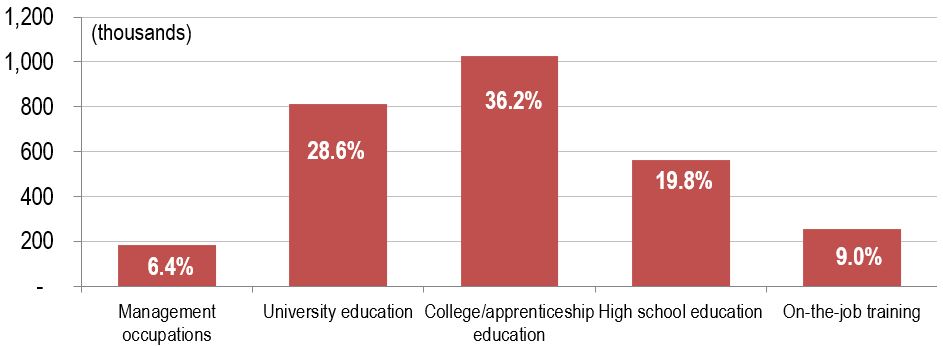
Figure 6 and Table 1 show the distribution of expansion demand by usual educational requirement over the projection period.
Figure 6: Distribution of Expansion Demand by Usual Educational Requirement, Projection 2022-2031
Source: ESDC 2022 COPS Projections.
Text version of Figure 6: Distribution of Expansion Demand by Usual Educational Requirement, Projection 2022-2031
| Management | University education | College education | High school education | On-the-job training | |
|---|---|---|---|---|---|
| Employment (AAGR*) | 1.0% | 1.7% | 1.5% | 1.1% | 1.3% |
| 2021 Employment Distribution | 8.8% | 23.1% | 33.8% | 24.7% | 9.6% |
*AAGR: Annual Average Growth Rate
Sources: Statistics Canada (historical) and ESDC 2022 COPS Projections.
In 2021, the largest share of employment was in occupations that usually require a college education or apprenticeship training, followed by those that usually require high school education. Occupations that usually require a university education, only on-the-job training, and management occupations ranked third, fourth and fifth, respectively.
Over the projection period, occupations that usually require a university education are expected to have the strongest overall employment growth, contributing also to the largest number of jobs created among all educational requirement levels. This is mostly the result of strong growth expectations in occupations related to professional services in health, as well as in the natural and applied sciences fields, especially among the information technology sector.
Occupations that usually require a college education or apprenticeship training are projected to have the second largest contribution in terms of job creation.
Stronger employment growth among occupations that typically require post-secondary education is largely explained by a more limited impact of technological progress and the strong labour requirements in the health care sector as a result of population aging.
On the other hand, occupations that typically require only high-school education or less and on the job training have a higher content of routine and manual tasks that can be more easily automated, which partially limits their employment growth.
Figure 7 shows the distribution of employment by usual educational requirement over the periods 2012-2021 and 2022-2031. It shows that since stronger employment growth is projected in occupations that usually require post-secondary education, this will result in a slight increase in the share of occupations that usually require post-secondary education within total employment.
Figure 7: Distribution of Employment by Usual Educational Requirement
Sources: Statistics Canada (historical) and ESDC 2022 COPS Projections.
Text version of Figure 7: Distribution of Employment by Usual Educational Requirement
As about 65% of the employment growth is expected to be in occupations that usually require post-secondary education (university, college or vocational) over the period 2022-2031, their projected proportion among total employment is expected to increase to 57.5% on average over the projection period, up from 53.8% of total employment on average over 2012-2021.
Table 2 shows that employment growth is expected to be faster in several health related occupations, and slower in some primary and manufacturing related occupations and some management occupations.
| Growth above 1.9%* | Growth below 0.8%* |
|---|---|
| Assisting occupations in support of health services | Office support occupations |
| Professional occupations in nursing | Processing and manufacturing machine operators and related production workers |
| Harvesting, landscaping and natural resources labourers | Workers in natural resources, agriculture and related production |
| Service supervisors and specialized service occupations | Trades helpers, construction labourers and related occupations |
| Technical occupations in art, culture, recreation and sport | Assemblers in manufacturing |
| Professional occupations in health (except nursing) | Middle management occupations in retail and wholesale trade and customer services |
| Technical occupations in health | Senior management occupations |
| Paraprofessional occupations in legal, social, community and education services | Care providers and educational, legal and public protection support occupations |
| Labourers in processing, manufacturing and utilities |
*Annual growth rate for total employment is 1.4%. Boundaries were set at plus and minus 5 percentage points of this growth rate..
Source: ESDC 2022 COPS Projections.
The growing demand for healthcare is expected to stimulate the demand for a number of professional and technical health-related occupations over the projection period.
Occupations related to sectors that were highly impacted by the pandemic, such as art, culture and tourism, are going to benefit from the ongoing recovery that will support employment growth during the first few years of the projection period.
Growth in harvesting, landscaping and natural resources labourers comes mostly from landscaping and grounds maintenance labourers which has been growing at a healthy pace over the past decades. This is expected to continue over the projected period as their services will be needed to assist in the construction of landscapes and related structures, and to maintain lawns, gardens, athletic fields, golf courses, cemeteries, parks, landscaped interiors and other landscaped areas.
With the exception of some occupations, growth for management occupations is projected to be close the aggregate average. Yet, employment in senior management occupations has declined since 2004, mostly because of the budget deficits reduction initiatives recorded by the various levels of government and because of the financial crisis. This situation is expected to continue at a slower pace over the projection period as austerity measures ease.
A weaker economic outlook in forestry and fishing, as well as in some manufacturing industries such as wood, paper, printing, textile and clothing, is expected to limit employment growth in occupations usually requiring high-school education or less that are related to these industries.
Occupations related to office and clerical work are expected to also have below average employment growth. This is mostly due to the constant introduction of technologies that continue to transform secretarial work, leading to the specialization of administrative duties.
At a more detailed occupational level (4-digit NOC groupings), Table 3 shows the 10 occupations that are expected to have the stronger employment growth over the projection period. It shows that most of the 10 detailed occupational groupings with the strongest projected employment growth are concentrated in occupations that were impacted by the pandemic and will continue to recover employment losses over the next few years.
| NOC | Occupations | Employment (2021) |
Growth Rate (2022-2031) |
|---|---|---|---|
| 6522 | Pursers and flight attendants | 6,200 | 7.1% |
| 3011 | Nursing co-ordinators and supervisors | 29,800 | 3.7% |
| 6321 | Chefs | 49,600 | 3.6% |
| 6511 | Maîtres d’hôtel and hosts/hostesses | 41,000 | 3.5% |
| 5250* | Athletes, coaches, referees and related occupations | 112,800 | 3.4% |
| 6530* | Tourism and amusement services occupations | 7,500 | 3.3% |
| 6720* | Support occupations in accommodation, travel and amusement services | 44,100 | 3.3% |
| 0510* | Managers in art, culture, recreation and sport | 11,300 | 3.2% |
| 1226 | Conference and event planners | 20,400 | 3.2% |
| 6523* | Airline ticket and service agents & Ground and water transport ticket agents, cargo service representatives and related clerks | 11,300 | 3.1% |
Note 1: Occupations with a star are groupings of 4-digit occupations (including 3-digit occupations which are considered as groups of 4-digit occupations).
Note 2: Occupations in bold are those where at least 50% of their workers were women in 2021.
Source: ESDC 2022 COPS Projections.
With the exception of nursing co-ordinators and supervisors (NOC 3011), all the other occupational groupings in the top 10 of strongest employment growth are concentrated in sectors that were highly impacted by public health measures introduced by governments to reduce the spread of COVID-19 cases. All those occupational groupings recorded substantial employment losses in 2020, and while some recovery occurred in 2021, they remained well below pre-pandemic level.
In the short-term, these occupational groupings are expected to record strong employment growth, given that all pandemic related restrictions have been removed across the country. The pent-up demand will drive growth during the first years of the projections.
Over the medium-term, employment growth is expected to be more modest and return to more sustainable trend among these occupations, in line with population growth and fueled by discretionary spending by a population that is ageing. However, employment in some of these occupational groupings is still expected to remain below their pre-pandemic level by the end of the projection period.
Other occupations with strong long-term growth, but not in this list, are related to the health care sector, the technology progress (ICT occupations, for example) and the transition to the green economy (some construction trades, such as electricians, for example).
Table 4 presents the top ten occupations with the largest employment declines over the projection period. It shows that the strongest employment declines are expected in some occupations related to fishing, wood and paper manufacturing and services.
| NOC | Occupations | Employment (2021) |
Growth Rate (2022-2031) |
|---|---|---|---|
| 6621 | Service station attendants | 8,300 | -6.6% |
| 6521 | Travel counsellors | 9,800 | -3.3% |
| 7272 | Cabinetmakers | 3,600 | -1.2% |
| 9614 | Labourers in wood, pulp and paper processing | 16,200 | -1.1% |
| 8260* | Fishing vessel masters and fishermen/women | 12,400 | -0.8% |
| 9432* | Pulp mill machine operators; Papermaking and finishing machine operators& Paper converting machine operators | 19,600 | -0.8% |
| 8440* | Other workers in fishing and trapping and hunting occupations | 4,200 | -0.7% |
| 4168* | Program officers unique to government & Other professional occupations in social science, n.e.c. | 10,400 | -0.7% |
| 0811 | Managers in natural resources production and fishing | 16,700 | -0.7% |
| 7281 | Bricklayers | 10,400 | -0.5% |
Note 1: Occupations with a star are groupings of 4-digit occupations (including 3-digit occupations which are considered as groups of 4-digit occupations).
Note 2: Occupations in bold are those where at least 50% of their workers were women in 2021.
Source: ESDC 2022 COPS Projections.
The two occupations (NOC 6621 and 6521) that are expected to face the largest job losses are occupations for which employment has been on a declining trend for a number of years. In both cases, this trend is expected to continue. Fuel service stations attendants will continue to be less and less needed, while the continued popularity of airline tickets and trip packages sales on the Internet and the decrease in commissions paid to travel agencies by air carriers will lower demand for travel counsellors.
Cabinetmakers (NOC 7272) employment has been on a downward trend for several years. Cabinetmakers have competed with an increasing use of prefabricated cabinets, which have become progressively cheaper and a viable option for renovators and homebuilders. This trend is expected to continue over the projected period, leading to a further decline in employment for cabinetmakers.
Two other occupations (NOC 8260 and 8440) are unique to the fishing industry. Both occupations are relatively small. Fish supply constraints and the various quotas and moratorium as well as productivity growth from the increased use of more efficient fishing boat equipment are expected to continue to lower employment in the fishing industry over the projection period.
Technological advancements and the increased use of digital imaging has come at the expense of labourers in wood, pulp and paper processing (NOC 9614) and printing press operators (NOC 9432).
Job Openings in Existing Positions (Replacement Demand)
Figure 8 shows the sources of replacement demand over the periods 2002-2011, 2012-2021 and 2022-2031. This figure shows that retirements will continue to represent the most important source of replacement demand.
Figure 8: Sources of Replacement Demand (in thousands)

Note:Historical retirements are constructed using data from the Longitudinal Administrative Database (LAD). Retirement is defined as a complete and permanent withdrawal from the labour market.
Sources: ESDC estimates (historical) and ESDC 2022 COPS Projections.
Text version of Figure 8: Sources of Replacement Demand (in thousands)
Economic growth is not the only source of job openings. Replacement demand is the other major source of job openings. These openings are created by the following factors:
- Retirements: approximately 3.9 million positions are expected to open up due to retirements over the period 2022-2031. As the baby-boom generation continues to retire, the replacement demand generated from this source is expected to continue to rise. Over the coming decade, retirements are projected to represent 80% of replacement demand, about the same as over the period 2012-2021, and compared to 76% over the period 2002-2011;
- In-service mortality: about 560 thousand jobs are expected to open up due to in-service mortality; and
- Emigration: nearly 436 thousand jobs are expected to open up due to emigration.
Figure 9 shows the overall retirement rate and indexed growth of retirement and employment over the period 2001-2031. It shows that retirements are expected to increase at a faster rate than employment in the first half of the projected period before slowing down once all the Baby boomers have retired.
Figure 9: Overall Retirement Rate and Indexed Growth of Retirements and Employment, 2001-2031
(Indexed Growth; 2008=100)

The shaded area represents the projection period.
Sources: ESDC estimates (historical) and ESDC 2022 COPS Projections.
Text version of Figure 9: Overall Retirement Rate and Indexed Growth of Retirements and Employment (Indexed Growth; 2008=100)
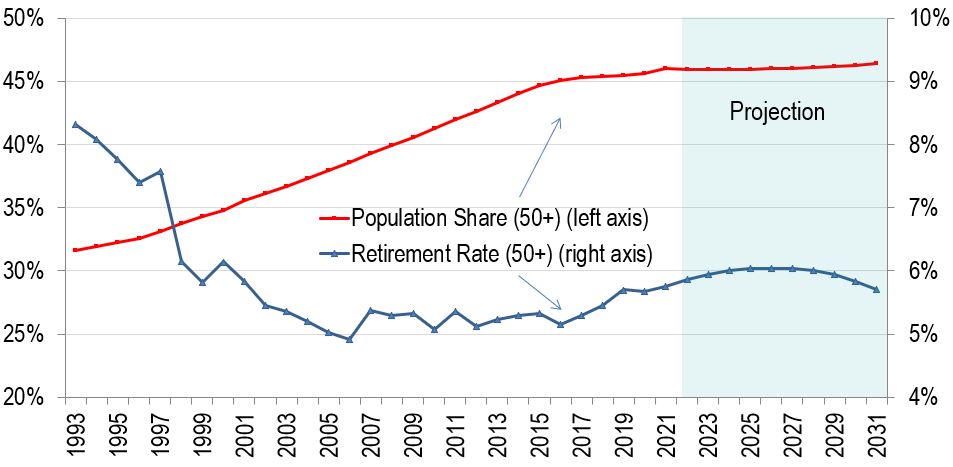
Retirement growth and employment growth were comparable prior to 2007, but the former started outpacing the latter as of 2007. As a result, the overall retirement rate, expressed as the number of retirees per employed worker, grew from 1.3% in 2006 to 1.9% in 2021.
This overall retirement rate is expected to peak in the mid-2020s. Accordingly, the acceleration in the number of retirees seen since 2008 is expected to continue, at least over the first half of the coming decade. However, as all baby boomers will be over 65 years old by 2030, the volume and rate of retirements will reach a plateau towards the middle of the projection period before declining in the second half and beyond 2031.
The number of retirements is projected to rise from an annual average of 315,000 over the period 2012-2021 to 390,000 annually over the period 2022-2031.
Retirements are expected to account for the largest source of job openings, but its share in total job openings is expected to slightly decline over the next ten years.
The projected increase in the number of retirements is primarily due to the ageing of the large baby boom cohort. This can be seen in Figure 10, which shows the share of the population aged 50 years and over and its retirement rate over the period 1993-2031.
Figure 10 shows the share of the Population Aged 50 and Over and its Retirement Rate. It shows that the projected increase in the number of retirements is primarily due to the ageing of the large baby boom cohort
Figure 10: Share of the Population Aged 50 and Over and its Retirement Rate, 1990-2031
The shaded area represents the projection period.
Sources: ESDC estimates (historical) and ESDC 2022 COPS Projections.
Text version of Figure 10: Share of the Population Aged 50 and Over and its Retirement Rate
The expected continued rise in the number of retirements and the overall retirement rate, at least over the first half of the projection period, is explained by the aging of the Canadian population.
More members of the baby boom generation will reach retirement age. The proportion of the population that are 50 years old or older is expected to continue to increase, but at a much slower pace. The upward trend in the retirement rate of these workers is projected to continue gradually, but it is expected to reach a plateau in the mid 2020s as all baby boomers will be 65 years old or older, and most of them would have retired before the end of the projection period.
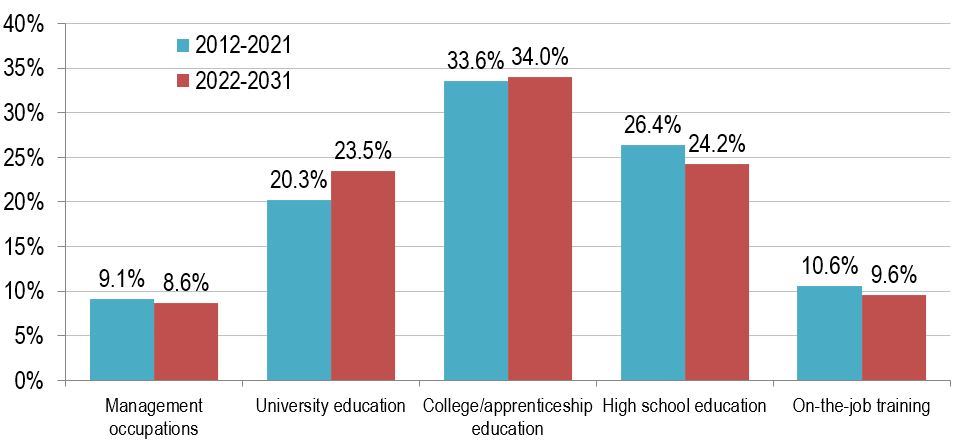
Figure 11 shows the share distribution of Retirements by Usual Educational Requirement over the projection period 2022-2031. It shows that about two-thirds of projected retirements are in occupations that usually require post-secondary education or in management occupations.
Figure 11: Distribution of Retirements by Usual Educational Requirement, Projection 2022-2031

Source: ESDC 2022 COPS Projections.
Text version of Figure 11: Distribution of Retirements by Usual Educational Requirement, Projection 2022-2031
| Management | University education | College education | High school education | On-the-job training | |
|---|---|---|---|---|---|
| Average Annual Retirement Rate | 2.6% | 1.6% | 1.9% | 1.6% | 1.6% |
| 10-year Retirements | 459,600 | 770,800 | 1,354,400 | 975,000 | 314,300 |
Source: ESDC 2022 COPS Projections.
However, retirements are not evenly distributed amongst occupations. Indeed, occupations that usually require post-secondary education (university, college or vocational) or in management occupations, which represented 65.4% of total employment in 2021, are expected to account for 66.4% of the job openings generated by retirements over the projection period.
The majority of the retirements are projected to be in occupations that have the largest proportions of employment. That is, they are expected to be in larger quantities in occupations that usually require college education or apprenticeship certificate and in those that usually require high school education.
Retirements will generate a disproportionately larger number of job openings in management occupations as these workers tend to be significantly older than average, despite tending to retire at a slightly older age. On the other hand, workers in occupations that usually require on-the-job training tend to be younger than average and tend to retire at a similar age than the all-occupations average, translating into a lower volume of retirements.
Concerning occupations that usually require university education, the strong employment growth in recent years as well as during the projection period means that retirement will represent a lower share relative to their employment share.
Therefore, projected retirement rates are the highest in management occupations and the lowest in occupations that usually require university education and on-the-job training.
Figure 12: Distribution of Retirements by Usual Educational Requirement
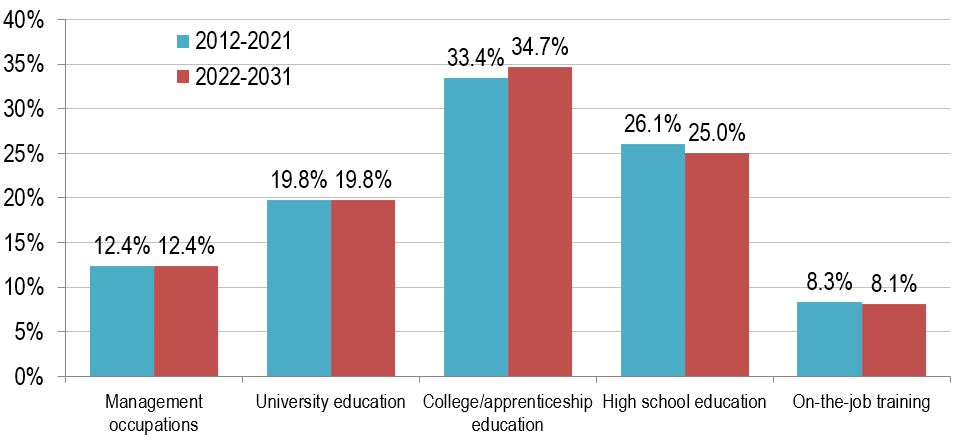
Source: ESDC 2022 COPS Projections. Estimated retirements over the historical period were obtained using data from the Longitudinal Administrative Database (LAD) and the Labour Force Survey from Statistics Canada.
Text version of Figure 12: Distribution of Retirements by Usual Educational Requirement
Yet, the distribution of retirements by usual educational requirement is projected to remain relatively stable over the period 2022-2031 when compared to the preceding decade. This can be seen in Figure 12, which displays the distribution of retirements by usual educational requirement over the periods 2012-2021 and 2022-2031.
As Table 6 shows, at the detailed occupational level (4-digit NOC groupings), occupations with the largest number of retirements are projected to be in occupations typically large in employment size. In fact, four of the top ten occupations have retirement rates that are lower the average (1.9%). Retail and wholesale trade managers (NOC 0621), and janitors, caretakers and building superintendents are projected to have the highest retirement rates among the top 10. On the other hand, the occupation of retail salespersons (NOC 6421) is expected to have the lowest retirement rate.
| NOC | Occupations | Total Retirements | Retirement Rate |
|---|---|---|---|
| 0621 | Retail and wholesale trade managers | 99,400 | 3.2% |
| 7511 | Transport truck drivers | 85,100 | 2.5% |
| 6421 | Retail salespersons | 78,900 | 1.4% |
| 3413* | Nurse aides, orderlies and patient service associates & Other assisting occupations in support of health services | 70,300 | 1.7% |
| 1311 | Accounting technician and bookkeepers | 66,100 | 2.9% |
| 6731 | Light duty cleaners | 65,900 | 2.8% |
| 4032 | Elementary school and kindergarten teachers | 62,500 | 1.6% |
| 1241 | Administrative assistants | 61,000 | 2.7% |
| 2171 | Information systems analysts and consultants | 59,600 | 1.8% |
| 6733 | Janitors, caretakers and building superintendents | 59,400 | 3.2% |
Note 1: Occupations with a star are groupings of 4-digit occupations (including 3-digit occupations which are considered as groups of 4-digit occupations).
Note 2: Occupations in bold are those where at least 50% of their workers were women in 2021.
Source: ESDC 2022 COPS Projections.
Table 7 shows that Occupations with the strongest projected retirement pressures (as per their retirement rates) includes management occupations, as they tend to be older than average.
| NOC | Occupations | Total Retirements | Retirement Rate |
|---|---|---|---|
| 7272 | Cabinetmakers | 1,500 | 4.7% |
| 0010* | Legislators and senior management | 23,800 | 4.1% |
| 0430* | Managers in public protection services | 2,200 | 4% |
| 0632 | Accommodation service managers | 25,500 | 3.9% |
| 6521 | Travel counsellors | 3,000 | 3.9% |
| 7512 | Bus drivers, subway operators and other transit operators | 37,200 | 3.7% |
| 4154 | Professional occupations in religion | 11,900 | 3.6% |
| 8241 | Logging machinery operators | 4,500 | 3.6% |
| 7513 | Taxi and limousine drivers and chauffeurs | 17,400 | 3.6% |
| 4412 | Home support workers, housekeepers and related occupations | 24,500 | 3.5% |
Note 1: Occupations with a star are groupings of 4-digit occupations (including 3-digit occupations which are considered as groups of 4-digit occupations).
Note 2: Occupations in bold are those where at least 50% of their workers were women in 2021.
Source: ESDC 2022 COPS Projections.
Occupations with the strongest projected retirement pressures (as per their retirement rates) includes management occupations, as they tend to be older than average.
Other occupations with relatively old workforce, such as bus drivers and taxi and limousines drivers, as well as professional occupations in religion are also expected to have higher retirement rates. The drivers occupations tend to employed workers over 25 years old due to insurance cost, making them older in average.
Finally, occupations such as cabinetmakers and travel counsellors have high retirement rates because employment is expected to decline over the projected period, while workers will continue to retire. As a result, their retirements will represent an increasing share relative to employment.
| NOC | Occupations | Total Retirements | Retirement Rate |
|---|---|---|---|
| 3213 | Animal health technologists and veterinary technician | 800 | 0.3% |
| 4012 | Post-secondary teaching and research assistants | 4000 | 0.4% |
| 3132 | Dietitians and nutritionists | 1,000 | 0.6% |
| 6511 | Maîtres d'hôtel and hosts/hostesses | 3,000 | 0.6% |
| 6311 | Food service supervisors | 5,400 | 0.6% |
| 2175 | Web designers and developers | 2,700 | 0.7% |
| 5250* | Athletes, coaches, referees and related occupations | 10,100 | 0.7% |
| 8614* | Mine labourers & Oil and gas drilling, servicing and related labourers | 600 | 0.7% |
| 6513 | Food and beverage servers | 9,900 | 0.7% |
| 2152* | Landscape architects; Urban and land use planners & Land surveyors | 1,200 | 0.7% |
Note 1: Occupations with a star are groupings of 4-digit occupations (including 3-digit occupations which are considered as groups of 4-digit occupations).
Note 2: Occupations in bold are those where at least 50% of their workers were women in 2021.
Source: ESDC 2022 COPS Projections.
Three of the ten occupations with the lowest retirement rates are expected to be in sales and services, which tend to employ a younger workforce.
Almost all occupations with the lowest retirement rates are related to the service industry and are characterized by a relatively young workforce. The only exception is Landscape architects; Urban and land planners and Land surveyors (NOC 2152/2153/2154). This occupation has a workforce of similar age than the average, but they retire much later in their career.
Only Mine labourers and Oil and gas drilling, servicing and related labourers are related to the goods-producing industry. This occupation usually requires on-the-job training and employs a high share of younger workers and the workforce tend to retire at a relatively advanced age.
Total Job Openings
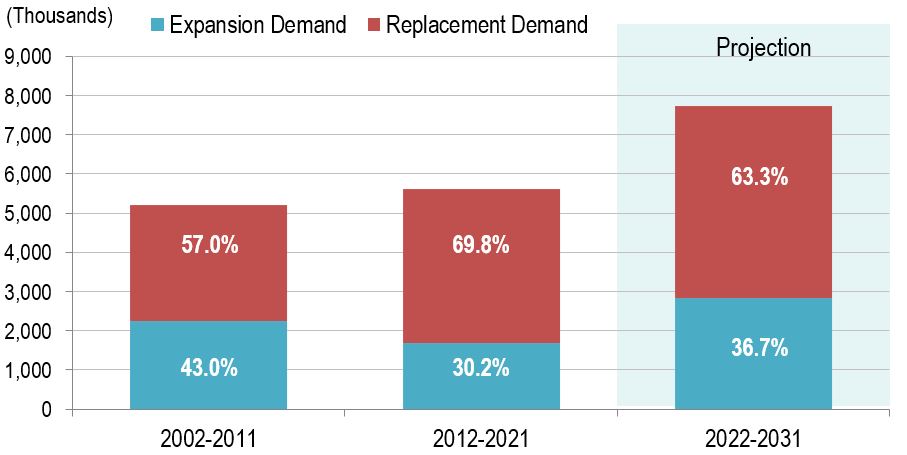
Figure 13 shows total job openings from expansion and replacement demand over the periods 2002-2011, 2012-2021 and 2022-2031. It shows that replacement demand is projected to represent nearly two thirds of all job openings over the coming decade.
Figure 13: Job Openings from Expansion and Replacement Demand
Source: Statistics Canada (historical) and ESDC 2022 COPS Projections.
Text version of Figure 13: Job Openings from Expansion and Replacement Demand
A total of 7.74 million job openings (those due to economic growth plus those due to replacement needs) are expected over the period 2022-2031. About 2.8 million are projected to be new positions as a result of increasing economic activity (expansion demand or employment growth), while over 4.9 million are projected to be existing positions being vacated due to replacement needs (retirements will account for 3.9 million of the 4.9 million positions being vacated).
As a result, replacement demand (mainly from retirements) is expected to represent 63.3% of all projected job openings over the period 2022-2031, down from 69.8% in 2012-2021, but up from 57.0% in 2002-2011.
The main reason why the share of replacement demand amongst total job openings during the projected period is lower than the last decade is because of the strong expansion demand expected in 2022 and 2023 as part of the labour market recovery from the impact of the COVID-19 pandemic. Beyond 2023, the share of replacement demand will be closer to 70%.
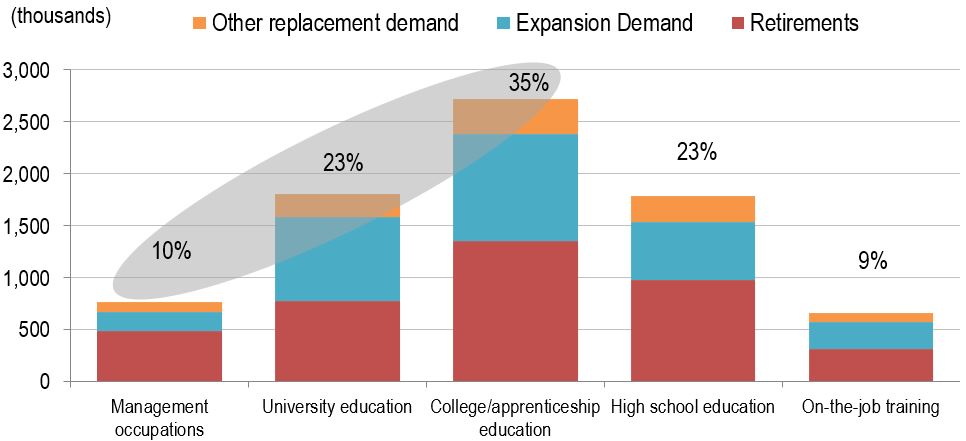
Figure 14 shows the total job openings from expansion and replacement demand by usual educational requirement over the period 2022 to 2031. It shows that more than two-thirds (or about 5.3 million) of the job openings are expected to be in occupations that usually require post-secondary education (university, college or vocational) or in management occupations. In fact, 71% of new jobs created by economic expansion are projected to be in occupations generally requiring post-secondary education or in management occupations, whereas 66.7% of job openings due to replacement will be in these occupational groups, for a combined average of 67.9% (around 5.3 million).
Figure 14: Job Openings from Expansion and Replacement Demand by Usual Educational Requirement, Projection 2022-2031
The shaded area represents the occupations are related to management or that typically required at least post-secondary education.
Source: ESDC 2022 COPS Projections.
Text version of Figure 14: Job Openings from Expansion and Replacement Demand by Usual Educational Requirement, Projection 2022-2031
Given that 71% of the new jobs are expected to be in occupations that usually require post-secondary education (university, college or vocational) or in management occupations over the period 2022-2031, their proportion among total employment will continue to rise in the coming decade. Indeed, the share of occupations that usually require post-secondary education (university, college or vocational) and management occupations out of total employment has grown from 60.5% in 2011 to 65.7% in 2021, and it is expected to reach 66.4% in 2031.
Over the next ten years, less than one-third of job openings (around 2.4 million) are expected to be in occupations usually requiring high school education or on-the-job training.
At the more detailed occupational level, Table 9 shows the top 10 4-digit occupations with the largest number of job openings over the projection period. occupations that are projected to have the largest number of job openings usually have a large employment size, resulting in relatively large replacement needs. Indeed, employment in those 10 occupations (10 out of 293 occupations) accounted for about 17.1% of total employment in 2021.
| NOC | Occupations | Employment (2021) |
Job Openings (2022-2031) |
|---|---|---|---|
| 3413* | Nurse aides, orderlies and patient service associates & Other assisting occupations in support of health services | 347,400 | 190,900 |
| 7511 | Transport truck drivers | 315,600 | 161,700 |
| 3012 | Registered nurses and registered psychiatric nurses | 327,000 | 155,500 |
| 6421 | Retail salespersons | 527,900 | 149,200 |
| 2171 | Information systems analysts and consultants | 288,100 | 143,600 |
| 4032 | Elementary school and kindergarten teachers | 353,600 | 125,300 |
| 6731 | Light duty cleaners | 2130,00 | 121,700 |
| 0621 | Retail and wholesale trade managers | 302,400 | 117,700 |
| 1311 | Accounting technician and bookkeepers | 206,500 | 116,500 |
| 6711 | Food counter attendants, kitchen helpers and related support occupations | 337,900 | 110,000 |
Note 1: Occupations with a star are groupings of 4-digit occupations (including 3-digit occupations which are considered as groups of 4-digit occupations).
Note 2: Occupations in bold are those where at least 50% of their workers were women in 2021.
Source: ESDC 2022 COPS Projections.
They can be summarized as follows:
- Two healthcare occupations are in the top three of the list of occupations with the largest number of job openings. Registered nurses and registered psychiatric nurses (NOC 3012) as well as Nurse aides, orderlies and patient service associates & Other assisting occupations in support of health services (NOC 3413/3414) are expected to have above average employment growth over the projection period. Given their large employment size, they are also expected to have large volumes of retirements. As the Canadian population ages, the demand for health services and consequently the need for healthcare professionals are projected to increase. Moreover, the commitment made by some provinces to reduce wait times at emergency rooms as well as for surgical procedures and specialized treatments is expected to contribute to the increase of labour demand for workers in these occupations.
- Similarly, employment growth is expected to be above average for Information systems analysts and consultants (NOC 2171), which will generate a large volume of job openings. Demand for workers in this occupation is expected to be supported by technological changes. Indeed, rapid innovation will continue to encourage firms to adapt quickly and upgrade their IT infrastructure to remain digitally safe and competitive. The increasing popularity of data science and analytics, involving predictive analysis, machine learning as well as artificial intelligence, will provide numerous opportunities to work as information systems analysts and consultants. Finally, the rising number and complexity of cyber attacks is expected to boost demand for workers with specific skills related to cyber security.
- Four occupations in sales and services (NOCs 6421, 6731, 0621 and 6711) are also part of the top 10 occupations where we expect the largest number of job openings, but mostly as a result of their large recovery in 2022 and their employment size. A similar case occurs with Elementary school and kindergarten teachers (NOC 4032).
- Similarly, job openings for Truck drivers (NOC 7511) are large mostly because of the overall size of this occupation. In fact, its openings rate is not significantly different than the national average. Although workers in this occupational group tend to be older than the average, they also tend to retire at a later age, resulting in a retirement rate that is similar to the average rate of all occupations.
- Finally, women represented more than 50% of workers in seven of these ten occupations in 2021.
Table 10 shows the Top 10 Occupational Groupings with the Highest Ratio of Job Openings. It shows that the highest ratios of job openings to employment are in health related occupations as well as occupations related to the tourism sector that were severely impacted by the pandemic.
| NOC | Occupations | Employment (20121) |
Job Openings (2022-2031) over 2021 Employment |
|---|---|---|---|
| 6522 | Pursers and flight attendants | 6,200 | 145.2% |
| 0430* | Managers in public protection services | 4,400 | 95.5% |
| 6530 | Tourism and amusement services occupations | 7,500 | 82.7% |
| 0632 | Accommodation service managers | 56,100 | 80.9% |
| 6523* | Airline ticket and service agents & Ground and water transport ticket agents, cargo service representatives and related clerks | 11300 | 78.8% |
| 3011 | Nursing co-ordinators and supervisors | 29,800 | 77.5% |
| 0510 | Managers in art, culture, recreation and sport | 11,300 | 76.1% |
| 4151 | Psychologists | 27,600 | 68.8% |
| 6321 | Chefs | 49,600 | 68.3% |
| 3111 | Specialist physicians | 45,400 | 65.9% |
Note 1: Occupations with a star are groupings of 4-digit occupations (including 3-digit occupations which are considered as groups of 4-digit occupations).
Note 2: Occupations in bold are those where at least 50% of their workers were women in 2021.
Source: ESDC 2022 COPS Projections.
To assess the size of labour demand in each occupation, the ratio of the projected number of cumulative job openings to the actual level of employment in 2021 was used. According to this indicator, the ten occupations with the largest ratios of job openings to employment are projected to be in healthcare occupations, as well as occupations related to the tourism sector. Concerning health care occupations, it is not surprising as these occupations are expected to experience strong employment growth (expansion demand). For those related to the tourism sector, this reflects the severe impact of the pandemic on these occupations. By 2021, most of these occupations still experienced significant employment deficit relative to their respective pre-pandemic level. Several of these occupations are expected to record strong employment growth in 2022 and 2023 as the tourism sector slowly recovers. However, in some cases, employment is not expected to return to its pre-pandemic level by the end od the projection period.
| NOC | Occupations | Employment (2021) |
Job Openings (2022-2031) over 2021 Employment |
|---|---|---|---|
| 6621 | Service station attendants | 8,300 | -34.9% |
| 6521 | Travel counsellors | 9,800 | 5.1% |
| 9614 | Labourers in wood, pulp and paper processing | 18,100 | 10.5% |
| 8614* | Mine labourers & Oil and gas drilling, servicing and related labourers | 8,300 | 13.3% |
| 2141* | Industrial and manufacturing engineers & Metallurgical and materials engineers | 25,300 | 15% |
| 9432* | Pulp mill machine operators; Papermaking and finishing machine operators& Paper converting machine operators | 19,600 | 15.8% |
| 2152* | Landscape architects; Urban and land use planners & Land surveyors | 15,900 | 17.6% |
| 7610* | Trades helpers and labourers | 100,700 | 17.7% |
| 7281 | Bricklayers | 10,400 | 19.2% |
| 2250* | Technical occupations in architecture, drafting, surveying, geomatics | 16,100 | 12.6% |
Note 1: Occupations with a star are groupings of 4-digit occupations (including 3-digit occupations which are considered as groups of 4-digit occupations).
Note 2: Occupations in bold are those where at least 50% of their workers were women in 2021.
Source: ESDC 2022 COPS Projections.
On the other hand, occupations that are expected to face the lowest ratios of job openings over the projection period are those related to sales and services (service station attendants and travel counselors), some manufacturing occupations, fishing, mining/oil/gas, and a couple of trades. Retirement pressures for most of those occupations are low as workers are generally younger. Also, employment growth for some of these occupations is expected to be below average or negative, as they are heavily impacted by technology advancement among other factors.
In 2021, women accounted for more than 50% of employment in five of the ten occupations with the largest ratios of job openings, but only in one with the lowest ratios. This is also reflected in occupations with a substantially high concentration of female employment (where at least 80% of the employment were women in 2021).
Table 12 shows a brief summary of job openings with a gender based lens. It shows that occupations where at least 80% of workers were women in 2021 are expected to have on average a slightly higher ratios of job openings than for those where the concentration was below 20% because of relatively stronger job creation and a higher proportion of retirements.
| There were 39 occupations where at least 80% workers were women in 2021 | There were 92 occupations where at least 80% workers were men in 2021 |
|---|---|
| Employment in these 39 occupations represented about 18.1% of total employment. | Employment in these 92 occupations represented about 23.6% of total employment. |
| On average, job openings in these occupations are expected to account for 41.9% of the 2021 employment over the projection period. | On average, job openings in these occupations are expected to account for 38.9% of the 2021 employment over the projection period. |
| 10 (or 25.6%) of the 39 occupations are expected to have a job opening ratio substantially above the average; 15 (or 38.5%) are expected to have a job opening ratio above the average of all occupations (41.0%). | 15 (or 16.3%) of the 92 occupations are expected to have a job opening ratio substantially above the average; 39 (or 42.4%) are expected to have a job opening ratio above the average of all occupations (41.0%). |
Of the 15 with above average job opening ratios:
|
Of the 39 with above average job opening ratios:
|
In 2021, 39 occupations had a significantly high concentration of female workers, a number lower than the 92 with a substantially elevated proportion of males.
The sum of the projected job openings of all the occupations with a significant concentration of female workers is expected to represent about 41.9% of their cumulative 2021 employment level. Of these, 15 occupations (38.5%) are projected to have ratios above the average of 41.0%. The larger employment size among these occupations, the relatively stronger job creation and their generally higher proportion of retirements, explain this situation. Occupations related to health; business, finance and administration; as well as education, law and social, community and government services represent the large majority of such occupations.
In comparison, job openings will represent about 38.9% of the 2021 employment among occupations with a strong concentration of males. Of these, 39 occupations (42.4%) are expected to have above average job openings ratios. Occupations related to trades, transport and equipment operators, natural and applied sciences, natural resources and agriculture, as well as manufacturing account for the majority of such occupations.
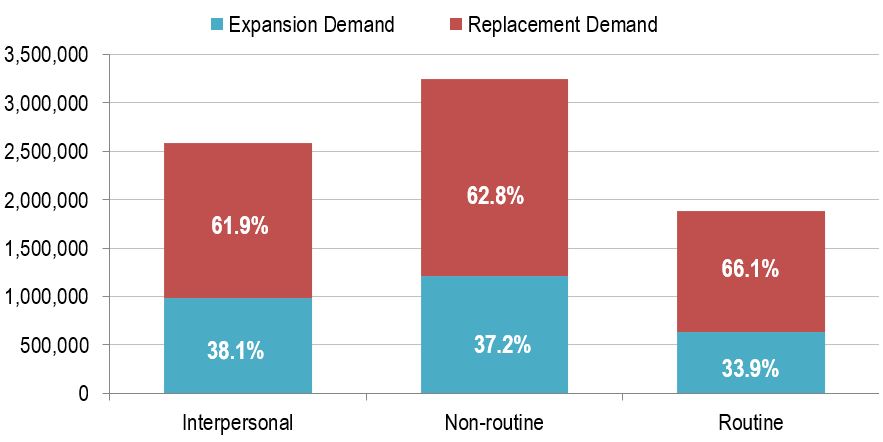
Figure 15 shows the projected number and share of job openings from expansion demand and replacement demand, by type of task, over the period 2022-2031. It shows that replacement demand is projected to represent the largest share of job openings for all types of tasks.
Figure 15: Job Openings from Expansion and Replacement Demand by Type of Tasks, Projection 2022-2031
Sources: Statistics Canada (historical) and ESDC 2022 COPS Projections.
Text version of Figure 15: Job Openings from Expansion and Replacement Demand by Type of Tasks, Projection 2022-2031
Out of the 7.74 million projected job openings (those due to economic growth plus those due to replacement needs), a little more than 3.2 million of those job openings (42.1%) are expected to have a high content of non-routine tasks. About 1.2 million (37.2% of them) are projected to be new positions resulting from increasing economic activity (expansion demand or employment growth), and about 2.0 million are projected to be existing positions being vacated due to replacement needs (retirements will account for 1.6 million of the 2.0 million positions being vacated).
A little less than 2.6 million of the job openings are expected to have a high content of interpersonal tasks. This type of tasks will have the highest share of job openings resulting from expansion demand (or employment growth), accounting for a little less than 1 million openings (38.1%). The need to replace some 1.6 million existing positions will still represent about 62% of job openings (of which 1.27 million will be from retirements).
Occupations with overall high shares of interpersonal and non-routine cognitive tasks are expected to have the largest proportion of job openings.
Finally, occupations with a high content of routine tasks are expected to account for about 1.9 million of job openings. About two-thirds of those openings will come from replacement needs (about 1.24 million, of which, 1 million are from retirements), while the remaining 640,000 openings are projected to be new positions as a result of increasing economic activity.