Canadian Occupational Projection System (COPS)
Job Seekers (2022-2031)
The 2022 COPS exercise was developed using the 2016 version of the National Occupational Classification (NOC). The 2016 NOC has 500 occupations. However, many of these occupations are small in terms of employment. Such occupations were combined into broader groupings according to the specific tasks of each occupation. By grouping small occupations with similar tasks together, 293 occupational groupings were obtained. Occupations that were grouped are marked with an asterisk (*).
Although NOC already has a more recent version (2021), the model’s input data were only available in the 2016 version of the NOC at the time of the development of the projections.
For more information on the 293 occupational grouping used in COPS, please visit the COPS Occupational Groupings' Definition.
Job seekers include three primary groups: school leavers, new immigrants and other job seekers such as students and re-entrants:
- School leavers are people leaving their full-time education programs (either as dropouts or graduates) to participate in the labour force. They are considered at their highest level of education completed. For example, a post-secondary dropout is considered as a high-school graduate.
- New immigrants are foreigners who enter Canada each year (under any immigration class) as permanent residents and participate in the labour market.
- Other job seekers include:
- Occupational movers: those who change occupations without leaving the labour market.
- Net re-entrants: those who had previously left the labour force and return to participate in the labour market.
- Working students: individuals who look for work while going to school.
The last two subgroups (i.e. net re-entrants and student workers) are negligible in size. As a result they are not explicitly considered in this report as their inclusion has no impact on the main results. In particular, student workers are left out because, although they represent a sizeable number of workers in the labour force, their number is expected to remain relatively stable (i.e. the number of students seeking employment over 2022-2031 will only be slightly higher than over the previous decade). Both net re-entrants and student workers are combined in the category “others”.
Job Seekers from the Education System (School Leavers)
Over the period 2022-2031, the number of school leavers entering the labour market is projected to increase, lead entirely by post-secondary education (PSE) graduates and it is expected that the number of school leavers entering the labour market will increase (see Figure 1 below).
Figure 1: School Leavers by Education Level, 1991-2031
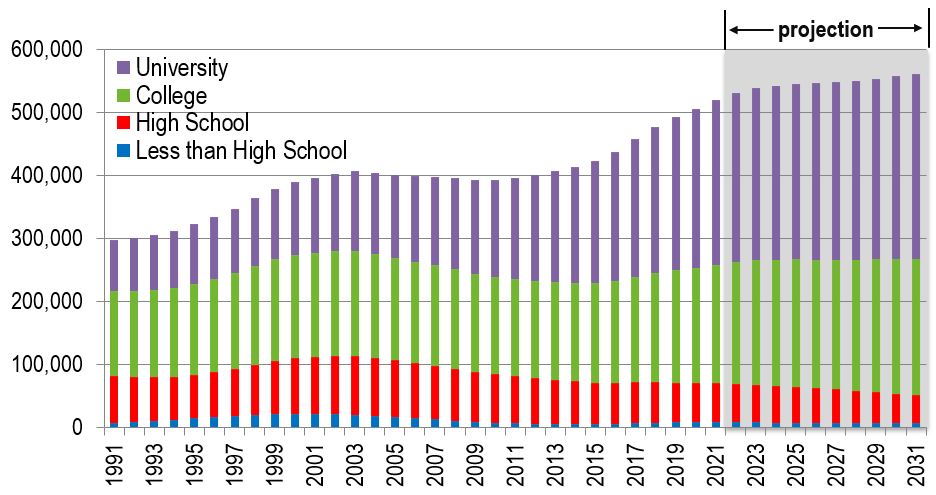
Source: Statistics Canada (historical) and ESDC 2022 COPS Projections.
Text Version of Figure 1: School Leavers by Education Level, 1991-2031
Figure 1 shows that on average, there were 454,000 school leavers per year over the 2012-2021 period. This is expected to increase to 548,000 annually over the projection period. More particularly:
- the numbers of school leavers with a college or a university education are projected to increase at annual average growth rates of 1.4% and 1.2% respectively;
- the number of school leavers with less than a high school education is projected to remain very low and will continue to represent less than 1.5% of all school leavers.
Over the 2022-2031 projection period, the aging population will continue to be an important issue in the Canadian labour market. Over this time period, the share of the older youth group (aged 20-29) in the total working age population (15-64) is expected to average 19.7% annually, the lowest ten year average since 1971.
Figure 2: Populations Aged 15 to 19 and 20 to 29 and their Shares in the Total Working Age Population (15-64), 1991-2031
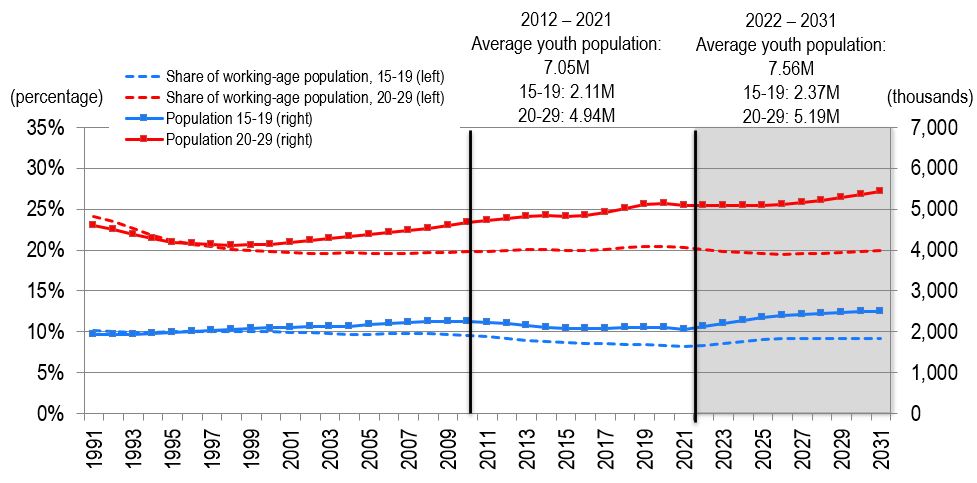
Source: Statistics Canada (historical) and ESDC 2022 COPS Projections.
Text version of Figure 2: Populations Aged 15 to 19 and 20 to 29 and their Shares in the Total Working Age Population (15-64), 1991-2031
However, the annual average population of this youth group (aged 20-29) is still expected to be 5.2% higher over the projection period (2022-2031) than during the previous ten years (2012-2021). As this is the source population for school leavers with a post-secondary education (PSE), the number of job seekers leaving the PSE system is also expected to increase.
The annual average number of younger youth (aged 15-19) is expected to be about 2,372,000 over the projection period, a 12.3% increase relative to the previous ten years, largely attributed to larger inflow of immigrant families with young kids. Although this age group is the source population for school leavers with a high school education or less, most of them are expected to continue and enroll into post-secondary education, limiting the growth of those remaining with only a high school diploma.
Figure 3: Enrolment Rates by Level of Education (as Percentage of Source Population), 1991-2031
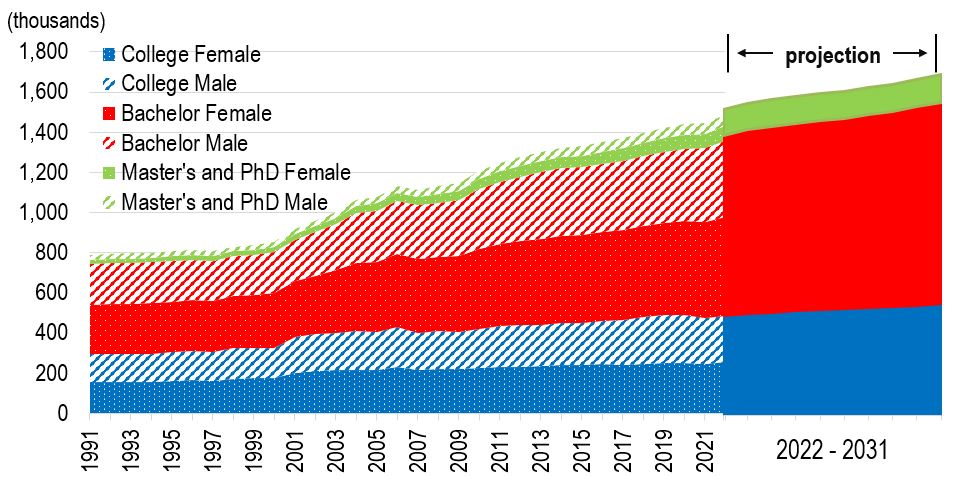
Source: Statistics Canada (historical) and ESDC 2022 COPS Projections.
For each educational level, the enrolment rate is defined as total enrolment divided by source population. The source population is defined as:
- PhD: 25-34 years old;
- Master's: 25-29 years old;
- Bachelor and first professional degree: 18-24 years old. (First Professional programs are those to prepare for specific occupations such as general physicians and lawyers);
- College: 18-24 years old; and
- High school: 13-14 years old.
Text version of Figure 3: Enrolment Rates by Level of Education (as Percentage of Source Population), 1991-2031
Due to a larger youth population, the level of enrolments in PSE programs is projected to increase by 11.2% over the 2022-2031 period (from 1.44 million in 2021 to 1.65 million in 2031). More specifically, the number of enrolments in:
- college programs is projected to increase by 11.3%, from 473 thousand in the base year (2021) to 543 thousand in 2031;
- bachelor and first professional programs is projected to rise by 11.9%, from 847 thousand in 2021 to 977 thousand at the end of the projection period (2031) and;
- post-graduate level programs (master and PhD) is projected to rise by 4.2%, from 125 thousand in 2021 to 133 thousand in 2031.
Trends in the number of enrolments by gender were not projected.
Higher enrolments translate into increases in the number of school leavers with PSE, including both, those with a college education (Figure 4) and those with a university degree (Figure 5).
Figure 4: School Leavers with a College Education, 1991-2031
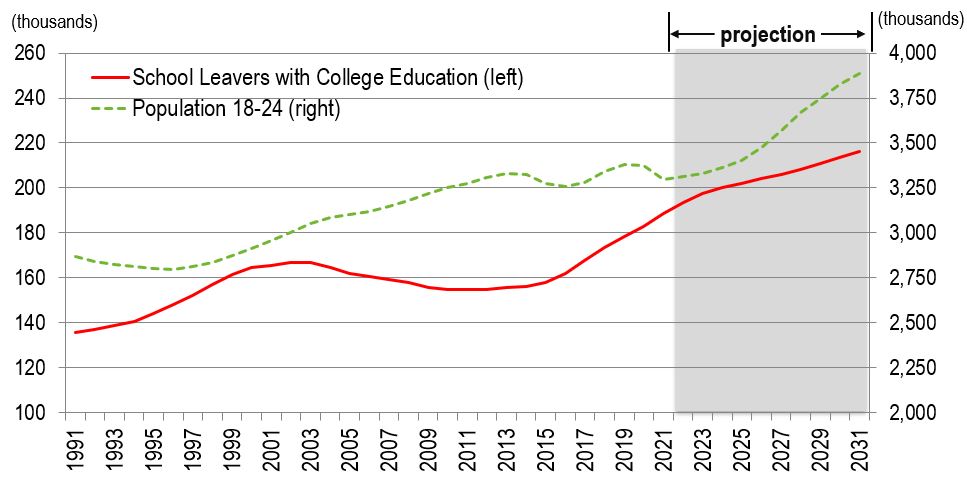
Source: Statistics Canada (historical) and ESDC 2022 COPS Projections.
Text version of Figure 4: School Leavers with a College Education, 1991-2031
The population aged 18 to 24 (the source population for school leavers with a college education) has not increased significantly in recent years, but this trend is not expected to continue as this source population is expected to grow significantly over the projection period. This source population is expected to include 589,000 more people in 2031 than it did in 2021. As a result, the number of school leavers with a college education will continue to trend up, from 189 thousand in 2021 to 216 thousand in 2031, representing an increase of 14.8%. This can be explained by the increase in the youth population, many of whom will be attracted by the good labour market conditions for individuals with this level of education.
Figure 5: School Leavers with a University Education, 1991-2031
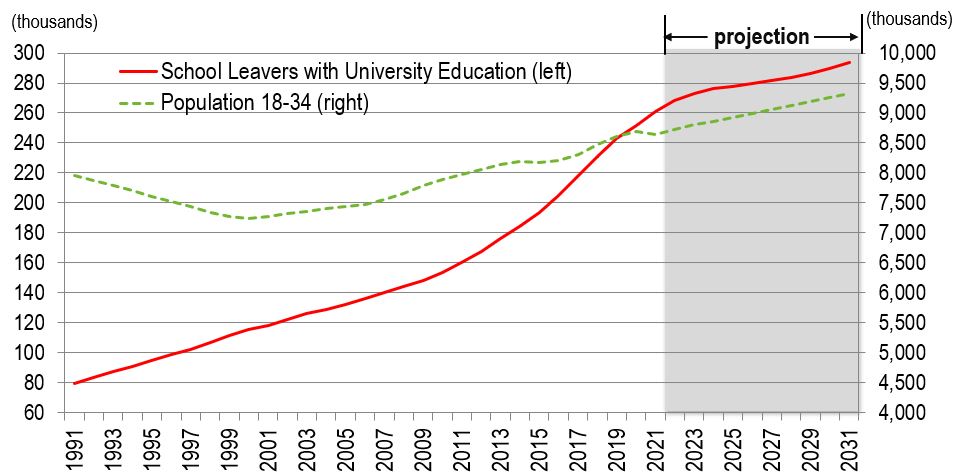
Source: Statistics Canada (historical) and ESDC 2022 COPS Projections.
Text version of Figure 5: School Leavers with a University Education, 1991-2031
For more than 40 years the number of school leavers with a university degree has been trending up, mostly as a result of the higher incomes and better labour market opportunities available to graduates with this level of education. Over the past decade, the 2008-2009 recession had a positive impact on enrolment in university programs leading to a short-term increase in the number of university graduates and school leavers from 2010 to 2017.
The number of school leavers with a university degree is expected to increase as the source population for this group (mainly high school graduates aged 18 to 34) grows and enrolment rates remain high. As a result, the volume of these school leavers is expected to grow by 12.5% over the projection period, from 261 thousand in year 2021 to 294 thousand in 2031. The good labour market conditions and higher income premiums for individuals with this level of education explain the continuation of this upward trend (see Figure 5).
Despite the increase projected in the youth 15-19 population, post-secondary education enrolments will limit the growth in the number of school leavers with only a high school diploma (or less).
Figure 6: School Leavers with High School Diploma and High School Dropouts 1991-2031
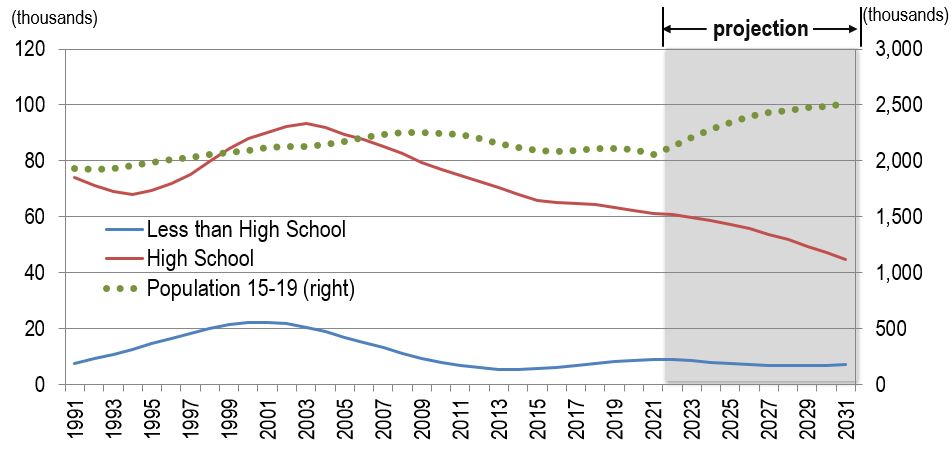
Source: Statistics Canada (historical) and ESDC 2022 COPS Projections.
Text version of Figure 6: School Leavers with High School Diploma and High School Dropouts 1991-2031
The number of school leavers with only high school has been trending down since the early 2000s as their source population (youth aged 15-19) has not been growing rapidly and a larger share of high school graduates has been continuing their education at the post-secondary level. Despite the large increase in the number of youth 15-19 years old over the next ten years, the number of graduates who have completed only high school are expected to continue declining as more high school graduates are expected to enroll in PSE. As a result, the average annual number of school leavers with only a high school diploma is expected to fall from the average of 66 thousand over the period 2012-2021, to the average of 54 thousand over the period 2022-2031.
The number of school leavers with less than high school education is expected to remain very low, with an annual average of 7,400 over the projection period. Despite an increase in the source population of youth aged 15-19, low wages, poor working conditions and limited labour market opportunities for individuals without at least a high school diploma will lead to the majority of young people attaining at the minimum a high school diploma, while increasing the number of those finishing their education with some level of PSE.
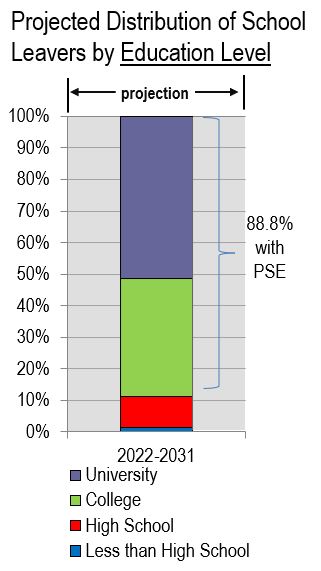
The share of those with post-secondary education (PSE) in total school leavers is therefore projected to increase over the period 2022-2031. This can be seen in figure 8, which shows the historical and projected percentage distribution of school leavers by educational level.
Figure 7: Historical and Projected Distribution of School Leavers by Education Level
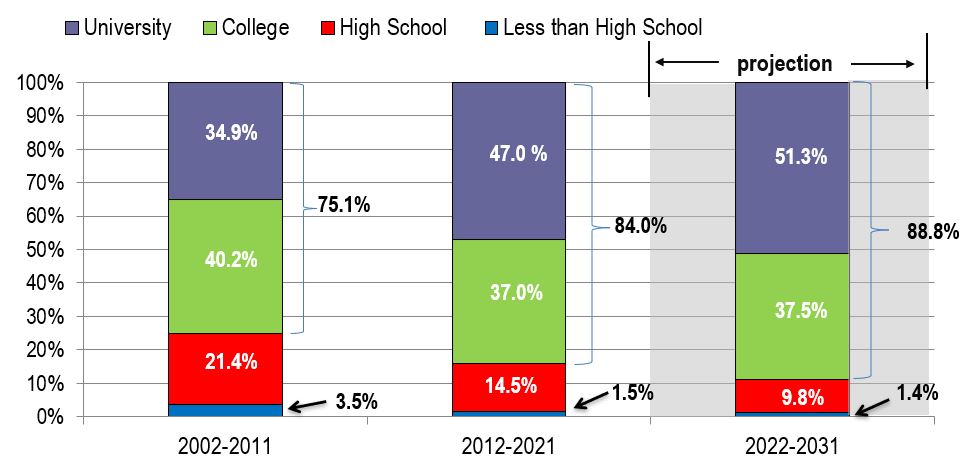
Source: Statistics Canada (historical) and ESDC 2022 COPS Projections.
Text version of Figure 7: Historical and Projected Distribution of School Leavers by Education Level
Figure 7 shows that the already high share of Canadian school leavers with PSE is expected to grow further over the projection period.
Indeed, school leavers with college and university education accounted for 84.0% of the total number of school leavers over the 2012-2021 period (3.81 million compared to 730 thousand for school leavers with lower educational attainment). This share is projected to increase to 88.8% (4.86 million school leavers with PSE) over the 2022-2031 period, driven by the large increase in the share of school leavers with college and university degrees.
Over the projection period, only 614 thousand school leavers are expected to enter the labour market without PSE. The number of school leavers with less than high school is expected to increased slightly from 69 thousand over the 2012-2021 period to 74 thousand over the period 2022-2031, representing only 1.4% of all school leavers over the projection period. However, the total number of those with only high school or some post-secondary education is projected to decline by about 17.9%, from 658 thousand over the 2012-2021 period to 539 thousand over the 2022-2031 period.
Therefore, the educational attainment of Canada’s labour force is expected to continue rising, with the share of the labour force with a PSE projected to increase to 73.0% in 2031, from 68.7% in 2021. However, with the diminishing difference in the educational attainment between the older cohorts and the younger cohorts, the rise in the share of people with PSE is projected to be slower than the one registered during the previous ten years, when it grew by 8.4 percentage points, from 60.3% in 2011 to 68.7% in 2021.
Figure 8: Share of the Labour Force (15+) with a Post-Secondary Education, 1991-2031
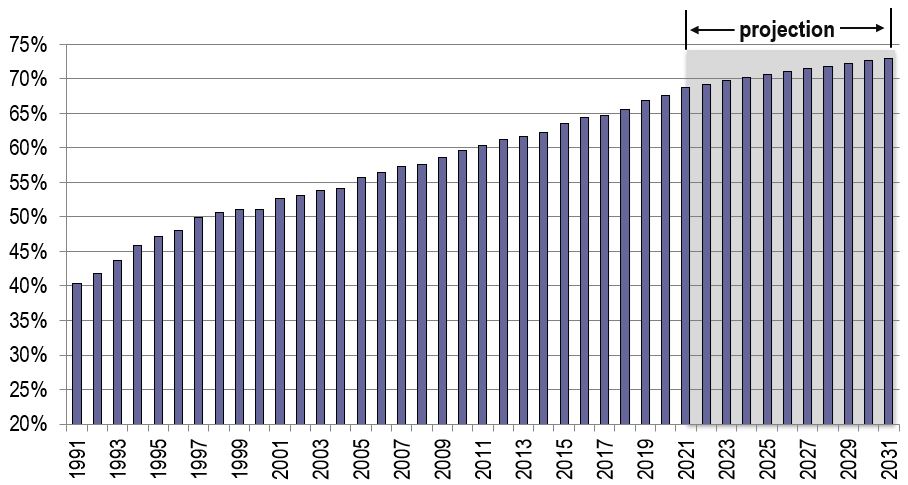
Source: Statistics Canada (historical) and ESDC 2022 COPS Projections.
Text version of Figure 8: Share of the Labour Force (15+) with a Post-secondary Education, 1991-2031
More specifically, the projected growth in the labour force will be the highest among university graduates (2.9% average annual growth rate (AAGR) over the 2022-2031 period) and college graduates (AAGR of 0.6%).
With regards to the labour force participants without PSE, as their projected share of the labour force will decrease slightly, their overall number is expected to stagnate and begin shrinking. The size of the labour force represented by those with high school is projected to grow at an annual average rate of just 0.1% and those with less than high school is projected to fall at an annual average rate of 1.7%.
However, not all the PSE school leavers are expected to work in occupations usually requiring PSE.
Figure 9: Historical and Projected Distribution of School Leavers by Skill Level*
Source: Statistics Canada (historical) and ESDC 2022 COPS Projections. Text version of Figure 9: Historical and Projected Distribution of School Leavers by Skill Level |
Figure 10: Projected Distribution of School Leavers by Education Level
Source: Statistics Canada (historical) and ESDC 2022 COPS Projections. Text version of Figure 10: Projected Distribution of School Leavers by Education Level |

*Note: In the NOC, all occupations fall into one of five skill levels. Skill Level A includes occupations that usually require university education; Skill Level B usually requires college education, specialized training or apprenticeship training; Skill Level C usually requires high school and/or occupation specific training; and Skill Level D usually requires only on-the-job training. The final skill level is Skill Level 0, which includes all management occupations where various levels of education may be required, but it is usually grouped with Skill Levels A and B as high skill.
School leavers are estimated at their highest level of education attained and then distributed among occupations following the historical patterns of school leavers with the same level of education.
Although Canadian school leavers are projected to be more educated (88.8% with PSE), only 67.7% are expected to work in occupations that usually require PSE or management occupations. This implies a relatively high incidence of education-occupation mismatch among recent PSE graduates as they leave school. In other words, a large proportion of school leavers with PSE enter the labour market to work in occupations that usually require lower levels of education (overqualified). This mismatch over the projection period represents an increase in comparison with the previous decade.
Part of this mismatch may be transitory as new school leavers need time to completely integrate into the labour force and into a matching occupation. They may land in lower skilled occupations when they first enter the labour market. Later, however, they might seek and move to occupations that better match their qualifications (note that this is taken into account in COPS by the inter-occupational mobility component).
At the occupational level, school leavers are expected to concentrate in sales and service occupations. Table 1 shows the top 10 occupations where the largest number of school leavers are expected to seek work over the period 2022 to 2031.
| NOC | Occupations | Share in Total School Leavers | Average Annual School Leavers as % of 2018 Employment | Employment Size (% of Total 2018 Employment) |
|---|---|---|---|---|
| 6421 | Retail Salespersons | 3.5% | 3.6% | 2.8% |
| 3012 | Registered nurses and registered psychiatric nurses | 2.9% | 4.8% | 1.7% |
| 4032 | Elementary school and kindergarten teachers | 2.4% | 3.7% | 1.9% |
| 6711 | Food counter attendants, kitchen helpers and related support occupations | 2.0% | 3.2% | 1.8% |
| 2171 | Information systems analysts and consultants | 1.9% | 3.6% | 1.5% |
| 1123 | Professional occupations in advertising, marketing and public relations | 1.7% | 4.7% | 1.1% |
| 2174 | Computer programmers and interactive media developers | 1.7% | 4.2% | 1.2% |
| 3413/3414* | Nurse aides, orderlies and patient service associates & Other assisting occs. in support of health serv. | 1.7% | 2.7% | 1.8% |
| 6611 | Cashiers | 1.6% | 2.8% | 1.7% |
| 1111* | Financial auditors and accountants | 1.5% | 3.8% | 1.2% |
Note 1: Occupations with a star are groupings of 4-digit occupations (including 3-digit occupations which are considered as groups of 4-digit occupations).
Note 2: Occupations in bold are those where at least 50% of their workers were women in 2021.
Source: Statistics Canada (historical) and ESDC 2022 COPS Projections.
Occupations where the largest number of school leavers will seek work are usually occupations with larger employment size. Out of the ten occupations expecting the largest number of school leavers, four are related to sales and services (10 out of the top 20). This can be explained in part by the lower skill requirements of entry level occupations, and also because of the relatively larger employment size of these occupations.
The popular demand for IT services has led to an increase in the number of people registering and graduating from IT related programs. This explains the 2 ICT occupations (NOCs 2171 and 2174) in the top 10 occupations with the largest number of school leavers.
Finally, women represented more than 50% of the employment in 8 out of these 10 occupations in 2021.
Job Seekers from Immigration (New Immigrants)
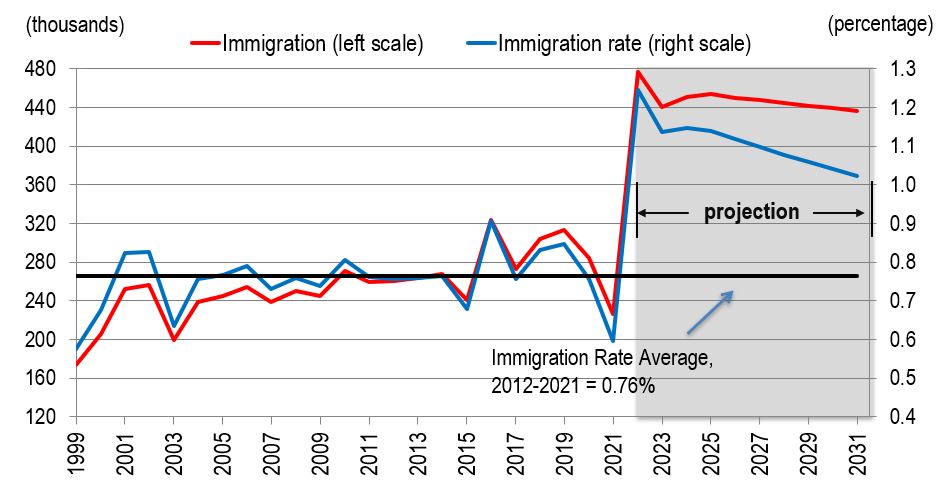
In the projection, annual immigration is assumed to represent a relatively higher share of the population relative to past decades, based on the official immigration targets set by the Canadian Federal Government for the next few years.
Figure 11: Annual Immigration Levels and Rates, 1999-2031
Source: Statistics Canada (historical) and ESDC 2022 COPS Projections.
Text version of Figure 11: Annual Immigration Levels and Rates, 1999-2031
Indeed, Figure 11 shows that the average immigration rate has historically been around 7.6 per 1,000 people in Canada, or 0.76%. Over the 2012-2021 period, this represented an average of 276,000 new immigrants entering Canada annually (from July to June each year). However, only a fraction of this total has joined the labour market upon entering Canada, as this number includes children and adults who may or may not join the labour force. Indeed, new immigrants effectively entering the labour market represented an average of 136,600 new entrants every year.
Following a significant decline in the number of new immigrants during the pandemic, new immigration policies target welcoming a significantly larger number of immigrants that in the past. This will lead to an immigration annual average rate of about 1.1% over the projection period. As a result, 4.5 million new immigrants are expected to join the Canadian population over the 10-year projection period.
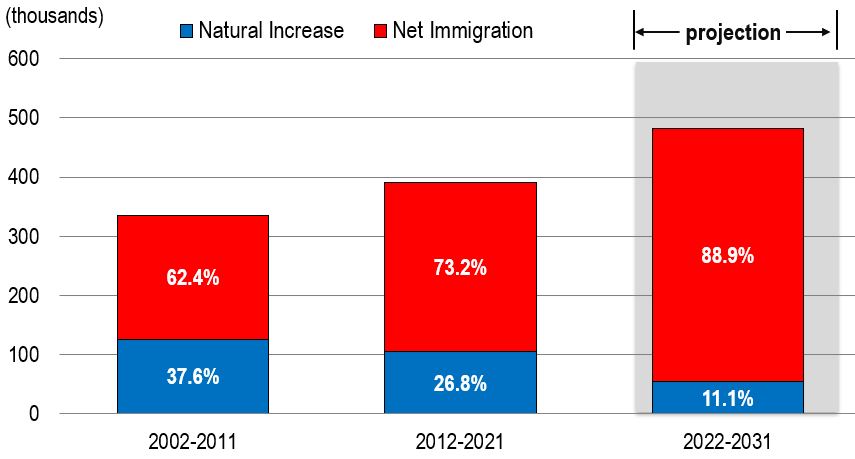
Figure 12 shows the annual population growth as a result of natural increase (births minus deaths, in blue), and net immigration (immigration minus emigration, in red), measured in thousands of people.
Figure 12: Population Growth by Demographic Component, Annual Averages
Source: Statistics Canada (historical) and ESDC 2022 COPS Projections.
Text version of Figure 12: Population Growth by Demographic Component, Annual Averages
In the projection, annual population growth averages about 482 thousand per year over the 2022-2031 period, compared to 391 thousand over the previous 10-year period.
The share of population growth stemming from net immigration (immigration minus emigration) is expected to increase to 89% over the 2022-2031 period, compared with 73% for the period 2012-2021 and 62% for the period 2002-2011. This is due both to an increase in net immigration itself and a slower natural population increase (births minus deaths).
Figure 13 shows that the share of population growth stemming from net immigration (immigration minus emigration) is expected to increase to 89% over the 2022-2031 period, compared with 73% for the period 2012-2021 and 62% for the period 2002-2011. This is due both to an increase in net immigration itself and a slower natural population increase (births minus deaths).
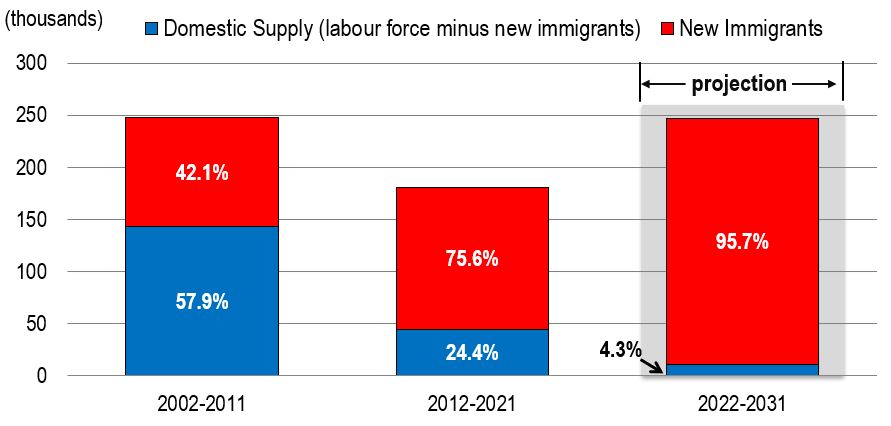
Figure 13 shows the annual average contribution of new immigrants and domestic supply to total labour force growth over the periods of 2002 to 2011, 2012 to 2021 and 2022 to 2031. The contribution of new immigrants to labour force growth is shown in red. The contribution of the domestic supply is in blue. This figure shows that immigration is expected to account for a much larger share of labour force growth over the projection period, compared to the previous 20 years.
Figure 13: Contribution of New Immigrants and Domestic Supply to Total Labour Force Growth: Annual Averages
Source: Statistics Canada (historical) and ESDC 2022 COPS Projections.
Text version of Figure 13: Contribution of New Immigrants and Domestic Supply to Total Labour Force Growth: Annual Averages
The projections show an increase in the net growth of the labour force over the projection period. This is a consequence of a large projected increase in immigration in comparison to the historical period. In turn, this will help compensating for the demographic pressures on the labour force arising from the current wave of baby-boomers entering retirement.
Without immigration, there would be little or no growth in the Canadian labour force over the next decade. Because of the slowdown in the domestic sources of growth, new immigrants are anticipated to represent about 96% of the annual average net growth of the labour force over the projection period, up from 76% during the previous 10 years. In fact, starting in 2026, immigration is projected to account for 100% of the net growth in the labour force.
Although immigration is the primary source of net growth in the labour force, it is not expected to be the main source of new labour market entrants in Canada. School leavers will remain as the main source of new job seekers (see Figure 16)
At the occupational level, annual immigration is distributed among occupations based on the distribution level of recent immigrants (those landed between 2011 and 2015) observed in the 2016 Census and the variation in employment through time obtained from the Labour Force Survey (LFS) for the period 2006-2021*. Past or future immigration policies that could potentially change this distribution, such as the Express Entry program, are not explicitly considered in the projections. However, they are implicitly included in the labour force participation rates obtained from the LFS.
Over the projection period, occupations where the largest number of new immigrants will seek work are expected to be mainly concentrated in sales and services because there are lower skill requirements in these entry level occupations. This can be explained by two reasons:
- credentials in some fields might not be well recognized in Canada; and
- some high-skill occupations could require working experience in Canada.
Note that one occupation is in the information technology (IT) field (Information systems analysts and consultants). The skills typically required to work in IT related occupations tend to be more globalized and less regulated in Canada. As a result, Canadian companies can more easily recognize foreign credentials as well as have access a broader labour pool.
| NOC | Occupations | New Immigrants | % 2021 Employment in the Occupation |
|---|---|---|---|
| 6711 | Food counter attendants, kitchen helpers and related support occupations | 105,800 | 31.3% |
| 6421 | Retail salespersons | 72,800 | 13.8% |
| 6731 | Light duty cleaners | 66,100 | 31.0% |
| 3413/3414* | Nurse aides, orderlies and patient service associates & Other assisting occupations in support of health services | 64,400 | 18.5% |
| 6322 | Cooks | 55,100 | 33.7% |
| 6611 | Cashiers | 53,200 | 16.7% |
| 2171 | Information systems analysts and consultants | 47,700 | 16.6% |
| 0621 | Retail and wholesale trade managers | 45,200 | 14.9% |
| 7511 | Transport truck drivers | 40,900 | 13.0% |
| 4411 | Home child care providers | 40,100 | 165.0% |
Note 1: Occupations with a star are groupings of 4-digit occupations (including 3-digit occupations which are considered as groups of 4-digit occupations).
Note 2: Occupations in bold are those where at least 50% of their workers were women in 2021.
Source: Statistics Canada (historical) and ESDC 2022 COPS Projections.
| NOC | Occupations | New Immigrants | % of 2021 Employment in the Occupation |
|---|---|---|---|
| 4411 | Home child care providers | 40,100 | 165.0% |
| 9616* | Labourers in textile processing & Other labourers in processing, manufacturing and utilities | 30,700 | 144.8% |
| 9617* | Labourers in food and beverage processing & Labourers in fish and seafood processing | 37,100 | 87.1% |
| 7272 | Cabinetmakers | 3,100 | 86.1% |
| 9462 | Industrial butchers and meat cutters, poultry preparers and related workers | 9,500 | 47.7% |
| 8611* | Harvesting labourers; Aquaculture and marine harvest labourers & Logging and forestry labourers | 3,600 | 46.8% |
| 4412 | Home support workers, housekeepers and related occupations | 30,700 | 45.8% |
| 0601 | Corporate sales managers | 7,400 | 45.4% |
| 9441* | Textile fibre and yarn, hide and pelt processing machine operators and workers; Weavers, knitters and other fabric making occupations; Fabric, fur and leather cutters & Inspectors and graders, textile, fabric, fur and leather products manufacturing | 2,300 | 44.2% |
| 6332 | Bakers | 13,200 | 43.6% |
Note 1: Occupations with a star are groupings of 4-digit occupations (including 3-digit occupations which are considered as groups of 4-digit occupations).
Note 2: Occupations in bold are those where at least 50% of their workers were women in 2021.
Source: Statistics Canada (historical) and ESDC 2022 COPS Projections.
Only three out of the 10 occupations with the highest projected proportion of new immigrants are in occupations usually requiring post-secondary education. One is a construction trade, one is related to retail/food services and one is a management occupation. In three of these occupations, the majority of workers in 2021 were female.
On the other hand, Table 4 shows the top 10 occupations where the smallest number of new immigrants are expected to seek work over the period 2022 to 2031.
| NOC | Occupations | New Immigrants | % of 2021 Employment |
|---|---|---|---|
| 4215 | Instructors of persons with disabilities | 400 | 5.3% |
| 8220* | Contractors and supervisors, mining, oil and gas | 400 | 1.6% |
| 8420* | Logging and forestry workers | 400 | 5.4% |
| 7360* | Train crew operating occupations | 200 | 1.6% |
| 7203 | Contractors and supervisors, pipefitting trades | 200 | 1.6% |
| 8231 | Underground production and development miners | 100 | 0.6% |
| 8260* | Fishing vessel masters and fishermen/women | 100 | 1.0% |
| 8241 | Logging machinery operators | 100 | 0.7% |
| 8211 | Supervisors, logging and forestry | 100 | 0.7% |
| 8440* | Other workers in fishing and trapping and hunting occupations | 50 | 0.7% |
Note 1: Occupations with a star are groupings of 4-digit occupations (including 3-digit occupations which are considered as groups of 4-digit occupations).
Note 2: Occupations in bold are those where at least 50% of their workers were women in 2021.
Source: Statistics Canada (historical) and ESDC 2022 COPS Projections.
Occupations where the smallest number of new immigrants are projected to seek work are mostly related to the primary industries. This might be explained by a few reasons:
- primary activity is mostly in rural areas and immigrants tend to settle mostly in large urban centres;
- some of these occupations are small in terms of employment size; and
- many of these occupations are seasonal and have fewer year-long employment opportunities.
Note that only one of these occupations employed more than 50% of women in 2021.
Job Seekers from Occupational Mobility (Occupational Movers)
New inflows do not represent all the sources of labour into occupations. In many occupations, workers from other occupations represent an important source of hiring. Occupations lose existing workers, but also gain workers from other occupations. The difference between the number of workers entering and the number of workers leaving a given occupation is called net occupational mobility. In the following slide, the term mobility always refers to net mobility in an occupation (or a skill level). In order to project future net mobility, observed past inter-occupational mobility patterns are used in conjunction with the estimated projected occupational labour demand to determine career paths that workers may follow over the projection period.
The COPS projections consider two types of occupational mobility:
- Vertical MobilityV: workers who move into occupations outside their current skill level. Two are considered:
- Upward mobility: workers who have gained labour force experience move to higher skilled occupations or management positions.
- Downward mobility: workers who choose to enter lower-skilled occupations, sometimes as part of their transition towards retirement or driven by higher salaries, for instance engineers leaving their occupations to become supervisors in the oil and gas sector.
- Horizontal Mobility: workers who move into occupations within the same skill level (i.e. occupations that usually require the same level of education).
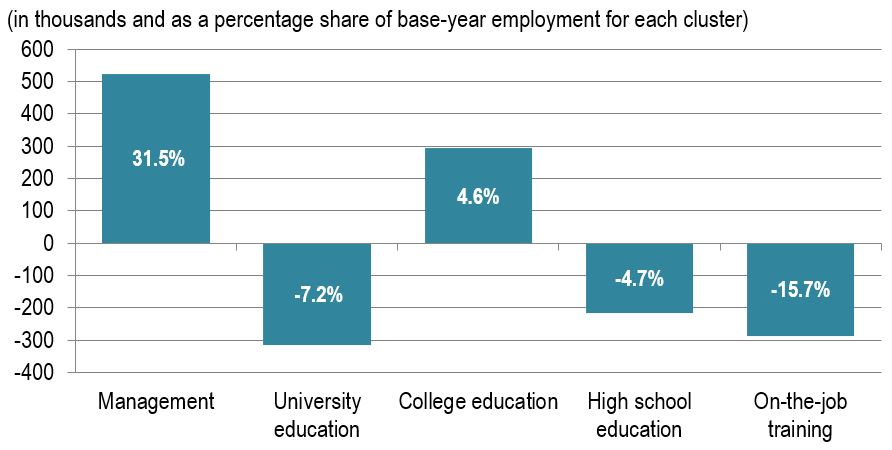
Figure 14 shows the projected number of workers moving between skill levels and their percentage share of 2018 Employment by skill level over the period 2022 to 2031.
Figure 14: Projected Number of Workers Moving Between Skill Level, 2022-2031
Source: ESDC 2022 COPS Projections.
Text version of Figure 14: Projected Number of Workers Moving Between Skill Level, 2022-2031
Management occupations have the largest relative mobility inflows among all skill levels, as many experienced workers from other skill levels seek to fill management positions left vacant mainly due to retirement. Over the 2022-2031 period, about 524,000 new managers are expected to come from occupations in other skill levels, mostly from occupations typically requiring university education. Moreover, mobility is the main source of supply for managers. Over the coming decade, more workers are expected to go up the skill ladder to become a manager than established managers leaving for a non-managerial occupation.
For those working in occupations requiring university education, net mobility is expected to be negative (-314,000). This is due to the fact that workers in this skill level are the main source of labour for managerial occupations. The large size also reflects the large outflow or worker in the managerial occupations due to their retirement volumes, which create numerous job opportunities for potential job seekers in other occupations.
Job openings in occupations usually requiring university education are either filled by overqualified workers employed in occupations requiring lower levels of education (those who started working in a lower skilled level occupation before seeking work in a new position better reflecting their qualifications) or by school leavers with a university degree. It is also possible that these openings will remain unfilled in some occupations if there is a shortage of workers with the necessary skills and knowledge.
Net mobility in occupations requiring college education is expected to be positive (+293,000). Similarly than for occupations typically requiring university education, many workers with a college degree start working in an occupation that only requires high-school or on-the-job training, before seeking work in a new position. This is also reflected by about 504,000 workers expected to move up from these occupations that do not require PSE education in the coming decade.
Total Job Seekers
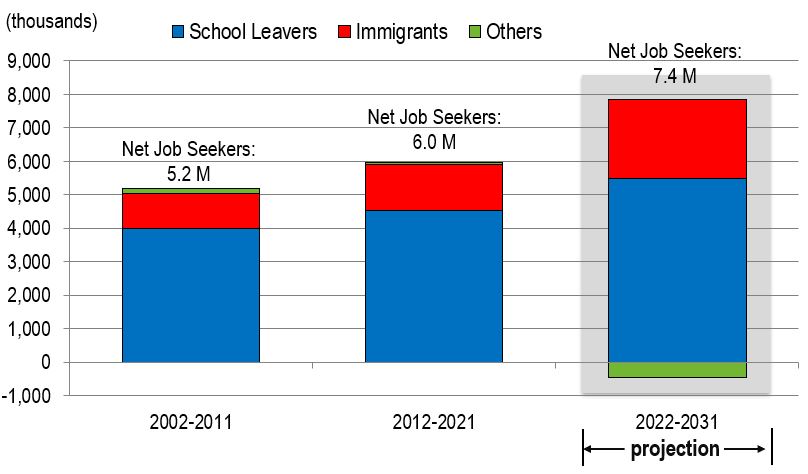
Figure 15 shows the sources of total new job seekers over the periods 2002 to 2011, 2012 to 2021 and 2022 to 2031. Even though new immigrants are expected to account for the majority of the net growth in the labour force over the next decade (see Figure 13), they will still represent a relatively small share of the total number of people who enter the Canadian labour market each year.
Figure 15: Sources of New Job Seekers: Totals
Source: ESDC 2022 COPS Projections.
Text version of Figure 15: Sources of New Job Seekers: Totals
In fact, the number of young people coming out of Canada’s education system (with or without any certificate, high school, or a post-secondary diploma), the so-called school leavers, is much larger than the number of new immigrants:
- over the 2012-2021 period, approximately 137,000 new immigrants and 454,000 school leavers were estimated to have entered the labour market yearly;
- over the projection period, an average of approximately 236,000 new immigrants are expected to enter the labour market every year, compared with approximately 548,000 new seekers coming from the education system;
- in the last decade, the ratio of the number of school leavers to that of new immigrants was about 3.32, compared to 2.31 over the projection period.
Hence, as the Canadian education system is expected to remain the primary source of new job seekers for the labour market, it will be important to ensure that the qualifications of these job seekers properly reflect the labour market needs.
Note: In the chart, the category “Others” includes a series of small components capturing labour market inflows and outflows such as those returning to school, labour market returns, and students that seek work while being registered in education programs. This category was negligible in the past, but is expected to become much larger – and negative, over the projection period. The total volume of job seekers will be reduced by about 500 thousand seekers (employed and unemployed) dropping out of the labour market due to discouragement or retirement of jobless workers. The outcome of this outflow will result in a reduction in the number of unemployed workers from 1.5 million in 2021 to about 1.15 million in 2031.
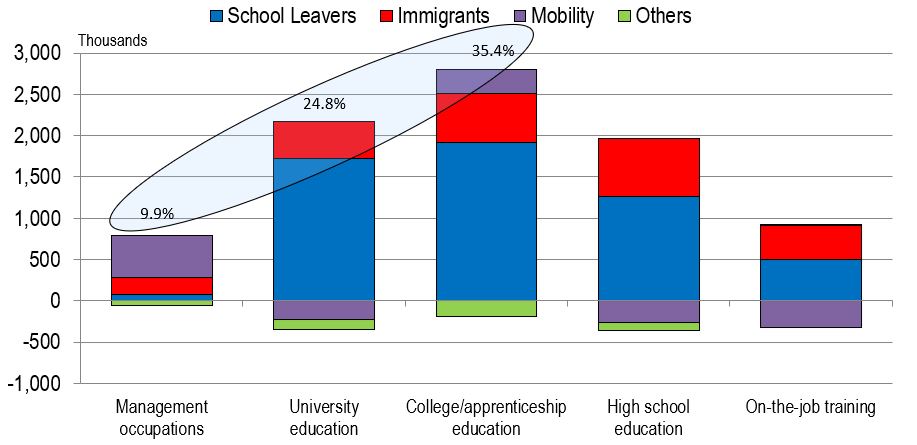
Figure 16 shows the total new job seekers by skill level over the period 2022 to 2031. It is projected that a total of 7.4 million job seekers (from the school system, immigration and other sources) to enter the labour market over the projection period.
Figure 16: Job Seekers by Skill Level, Projection 2022-2031
Source: ESDC 2022 COPS Projections.
Text version of Figure 16: Job Seekers by Skill Level, Projection 2022-2031
Over two-thirds (70.2% - around 5.2 million individuals) of these entrants are anticipated to be in occupations that usually require postsecondary education (college, university or vocational) or in management occupations. At a more detailed level:
- More than half of new immigrants (52.8%) are expected to pursue work in occupations generally requiring postsecondary education or in management positions;
- Upward occupational mobility is also expected to add job seekers for management occupations and those requiring college education. This upward mobility is mainly the result of previously mismatched skilled workers seeking work in occupations that better match their skills as well as promotion into management ranks.
About one-third of job seekers (around 2.2 million) are expected to look for work in occupations requiring only high school education or on-the-job training.
The majority of occupations projected to have the largest proportion of job seekers suffered job losses during the pandemic. As most of them recover, they are expected to welcome also a large number of job seekers, which results in a very high proportion of job seekers to employment in 2021. This is the case of occupations related to the service and sales sector, for example, Pursers and flight attendants (NOC 6522); Chefs (NOC 6321); and (Airline ticket and service agents & Ground and water transport ticket agents, cargo service representatives and related clerks (NOC 6523/6524).
| NOC | Occupations | Employment 2021 | New Job Seekers as a % of 2021 Employment |
|---|---|---|---|
| 6522 | Pursers and flight attendants | 6,200 | 125.8% |
| 7272 | Cabinetmakers | 3,600 | 105.6% |
| 0430* | Managers in public protection services | 4,400 | 100.0% |
| 6321 | Chefs | 49,600 | 90.5% |
| 0510* | Managers in art, culture, recreation and sport | 11,300 | 77.0% |
| 3213 | Animal health technologists and veterinary technician | 23,100 | 74.9% |
| 0213 | Computer and information systems managers | 72,500 | 73.7% |
| 3011 | Nursing co-ordinators and supervisors | 29,800 | 73.2% |
| 0632 | Accommodation service managers | 56,100 | 72.0% |
| 6523 | Airline ticket and service agents & Ground and water transport ticket agents, cargo service representatives and related clerks | 11,300 | 69.0% |
Note 1: Occupations with a star are groupings of 4-digit occupations (including 3-digit occupations which are considered as groups of 4-digit occupations).
Note 2: Occupations in bold are those where at least 50% of their workers were women in 2021.
Source: ESDC 2022 COPS Projections.
Four of the occupations in the list are in the management area, where workers are usually older and closer to retirement. Most workers in management occupations have worked there way up over the course of their career. As a result, it is expected that a larger share of workers in such occupations will retire over the projection period, creating job openings that will require filling. For these occupations, mobility is expected to play an important role in the source of job seekers, as the majority of potential new managers are already in the labour market.
Table 6 shows that the ranking of the 10 occupations projected to have the largest number of new job seekers largely reflects the fact that most of these occupations are large occupations in terms of employment size. In fact, employment in those 10 occupations (out of 293 occupations) accounted for about 17.1% of total employment in 2021. Four out of these 10 occupations are related to sales and services.
| NOC | Occupations | Employment 2021 | New Job Seekers | New Job Seekers as a percent of 2018 Employment |
|---|---|---|---|---|
| 3413/3414* | Nurse aides, orderlies and patient service associates & Other assisting occs. in support of health serv. | 347,400 | 170,100 | 49.0% |
| 6421 | Retail salespersons | 527,900 | 168,300 | 31.9% |
| 2171 | Information systems analysts and consultants | 288,100 | 157,800 | 58.8% |
| 7511 | Transport truck drivers | 315,600 | 144,400 | 45.8% |
| 3012 | Registered nurses and registered psychiatric nurses | 327,000 | 143,700 | 43.9% |
| 6711 | Food counter attendants, kitchen helpers and related support occupations | 337,900 | 137,600 | 40.7% |
| 1311 | Accounting technician and bookkeepers | 206,500 | 108,000 | 52.3% |
| 6731 | Light duty cleaners | 213,000 | 108,000 | 50.7% |
| 4032 | Elementary school and kindergarten teachers | 353,600 | 105,700 | 29.9% |
| 0621 | Retail and wholesale trade managers | 302,400 | 99,000 | 32.7% |
Note 1: Occupations with a star are groupings of 4-digit occupations (including 3-digit occupations which are considered as groups of 4-digit occupations).
Note 2: Occupations in bold are those where at least 50% of their workers were women in 2021.
Source: ESDC 2022 COPS Projections.
The ranking of the 10 occupations projected to have the largest number of new job seekers reflects the fact that most of these occupations are large in terms of employment size. In fact, employment in those 10 occupations (out of 293 occupations) accounted for about 17.1% of total employment in 2021.
Four out of these 10 occupations are related to sales and services.
| NOC | Occupations | Employment 2021 | New Job Seekers as a % of 2021 Employment |
|---|---|---|---|
| 6621 | Service station attendants | 8,300 | -48.2% |
| 6521 | Travel counsellors | 9,800 | -33.7% |
| 8611* | Harvesting labourers; Aquaculture and marine harvest labourers & Logging and forestry labourers | 7,700 | 5.2% |
| 9614 | Labourers in wood, pulp and paper processing | 18,100 | 12.2% |
| 9232* | Pulp mill machine operators; Papermaking and finishing machine operators& Paper converting machine operators | 19,600 | 13.8% |
| 8614 | Mine labourers & Oil and gas drilling, servicing and related labourers | 8,300 | 15.7% |
| 7610* | Trades helpers and labourers | 110,700 | 16.2% |
| 2141 | Industrial and manufacturing engineers & Metallurgical and materials engineers | 25,300 | 16.6% |
| 2152* | Landscape architects; Urban and land use planners & Land surveyors | 15,900 | 17.0% |
| 8420* | Logging and forestry workers | 6,700 | 17.9% |
Note 1: Occupations with a star are groupings of 4-digit occupations (including 3-digit occupations which are considered as groups of 4-digit occupations).
Note 2: Occupations in bold are those where at least 50% of their workers were women in 2021.
Source: ESDC 2022 COPS Projections.