Canadian Occupational Projection System (COPS)
Macroeconomic and Industrial Outlook (2024-2033)
| NOTE: The current COPS demographic and macroeconomic projections were completed in spring 2024, i.e. before the announcement by the Federal government of its intention to rapidly reduce the number of temporary residents from 6.5% of Canada’s total population in 2023 to 5% by 2027, as well as lower immigration targets as indicated in the publication of Immigration Refugees and Citizenship Canada 2025-2027 (target plans). These new lower non-permanents and permanents resident levels will result in weaker population growth over the projection period. Is it expected that these new targets will have a similar impact on labour demand and supply at the aggregate level, but some specific industries and occupations might be more affected than others. |
Introduction
The occupational projections prepared under the Canadian Occupational Projection System (COPS) require the production of a macroeconomic and industrial outlook to determine the future long-term trends in overall employment growth and in the distribution of employment across industries and occupations.
This document presents the macroeconomic and industrial outlook that underlies the 2024 COPS projections. This outlook was developed in collaboration with the Deloitte based on information available as of Spring 2024.
The future long-term trends in Canada’s economic growth will be heavily influenced by demographic developments, namely population aging and higher immigration. Such demographic changes are projected to have a significant influence in the long- term evolution of Canada's labour force, employment, and economic potential.
Demographics and Labour Force
Figure 1 shows that immigration will be significantly higher than previous decades.
Figure 1 : Components of Population Growth

Sources : Statistics Canada (historical data and projections). The shaded area represents projections.
Text version of figure 1 : Components of Population Growth
In early 2022, the federal government announced a significant increase in its immigration target to “ensure Canada has the workers it needs to fill critical labour market gaps and support a strong economy into the future”. Under this new plan, the number of new immigrants admitted annually in Canada will outpace the average of the past decade by almost 200,000.
In late 2023, the federal government reaffirmed its intention by announcing a target of 485,000 new permanent residents in 2024, and 500,000 in 2025 and 2026 to “prioritize economic growth, and support family reunification, while responding to humanitarian crises and recognizing the rapid growth in immigration in recent years”.
Consequently, an immigration rate of 11.4 per thousand is assumed over the projection period, which will result in about 500,000 immigrants a year over the 2024-2033 period.
As a result of a relatively low fertility rate and a rise in deaths due to population aging, the natural increase of the population (births minus deaths) is expected to continue to decline over the next decade, but at a slower pace than the previous decade. This slowdown essentially reflects the positive impact of increased immigration on births, as well as the number of deaths returning to more normal levels after a surge during the COVID-19 pandemic.
The declining trend projected in the natural increase of the population will result in immigration accounting for a rising share of Canada’s population growth.
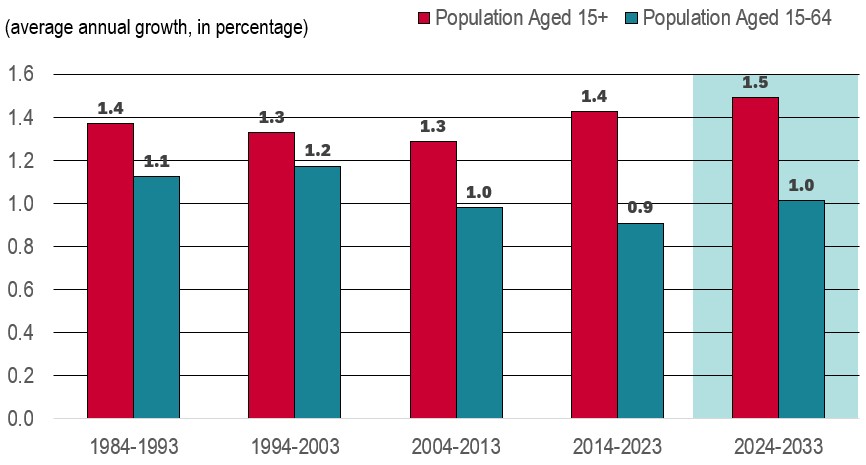
Figure 2 shows that growth in Canada’s population of working age is projected to strengthen over the period 2024-2033, stimulated by immigration.
Figure 2 : Growth in Canadian Population of Working Age
Sources : Statistics Canada (historical data and projections). The shaded area represents projections.
Text version of figure 2 : Growth in Canadian Population of Working Age
Growth in population aged 15+ is projected to average 1.5% annually over the period 2024-2033, up from 1.4% from 2014 to 2023 and 1.3% recorded over the periods 2004-2013 and 1994-2003.
The strong growth in permanent and temporary immigration led to a record increase in the working-age population in 2023 (+3.1%). It is expected that 2024 will register a similar gain, as recent trend in non- permanent residents should continue in the short-term. However, growth in the number of non-permanent residents is expected to level off and stop contributing to population growth after 2025. It is important to mentioned that these projections were completed before the announcement by the Federal government of its intention to reduce the number of temporary residents from 6.5% of Canada’s total population in 2023 to 5% by 2027, which is faster and larger than what is currently included in the COPS projections.
Population growth over the 2024-2033 period will be supported by immigration, as well as the anticipated improvement in life expectancy. Those developments will partly offset the slight decline projected in the natural increase of the population (births minus deaths) attributable to a low fertility rate and a rise in deaths due to population aging.
After declining since the 1990s, the pace of population growth of the 15-64 age group will accelerate slightly to 1.0% (up from 0.9% in the previous decade), as a result of higher immigration.
The baby-boomers’ generation (born between 1946 and 1965) will continue to gradually transition into the 65+ age group during the first half of the projection period, and the last ones will do so in 2030. The Millennials (born between 1981 and 1996) will continue to account for the largest share of the working-age population. The Alpha generation (born between 2013 and now) will see their older members entering the labour market in 2028 as those born in 2013 reach 15 years old. Their progressive transition into the working- age population will support the growth in the second part of the projection period.
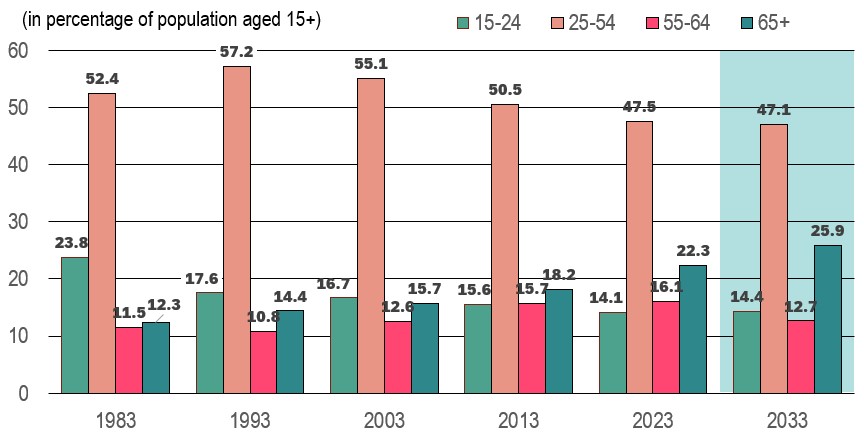
Figure 3 shows that people aged 65 and over will account for an increasing share of the working age population.
Figure 3 : Distribution of the Working Age Population by Age Group
Sources : Statistics Canada (historical data and projections). The shaded area represents projections.
Text version of figure 3 : Distribution of the Working Age Population by Age Group
Higher immigration will not stop population aging in Canada. Indeed, more baby-boomers will be entering in the 65+ age group over the projection period, boosting population growth in this older age group relative to the younger ones.
As a result, the 65+ age group will account for an increasing share of the working age population. By 2033, those aged 65+ are projected to represent 26% of the working age population, up from 22% in 2023 and 18% in 2013.
More baby-boomers reaching 65 means that they will exit the 55 to 64 age group. As a result, those aged 55 to 64 are projected to account for 13% of the working age population in 2033, down from 16% in 2023.
In the meantime, core age population will account for roughly 47.1% of the working-age population by 2033, slightly down from 47.5% in 2023. The share of youth aged 15 to 24 will remain stable at around 15%.
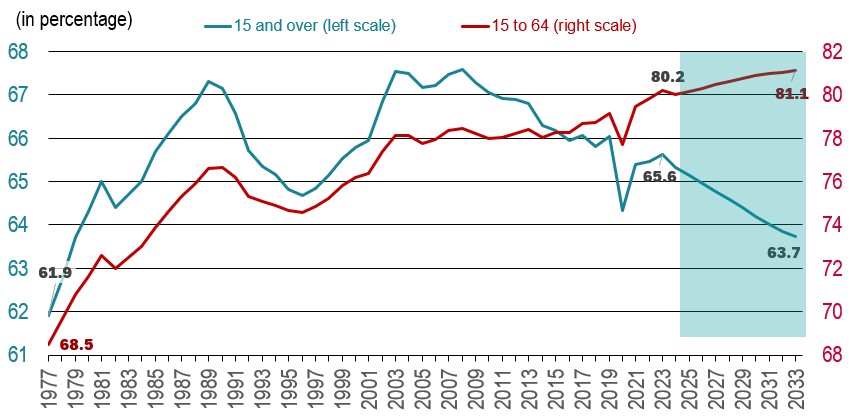
Figure 4 shows that the lower labour force attachment of older individuals will continue to pull down the overall labour force participation rate (15+).
Figure 4 : Labour Force Participation Rate (15+ and 15-64)
Sources : Statistics Canada (historical data) and ESDC 2024 COPS macroeconomic projections. The shaded area represents projections.
Text version of figure 4 : Labour Force Participation Rate (15+ and 15-64)
Participation rates are projected to increase among most age groups. However, as a result of population aging, the overall participation rate of the population aged 15 and over is expected to keep declining during the period 2024-2033.
The shift in the age composition of the working age population towards the lower attachment group of 65+ is projected to push further down the overall participation rate by 1.9 percentage points, from 65.6% in 2023 to 63.7% in 2033. Indeed, the proportion of people aged 65 and over, which have a much lower participation rates will continue to increase. In contrast, the proportion of people with higher participation rates, those aged 25 to 54 and 55 to 64, will continue to decrease, which will result in a lower average participation rate in the working age population (15+).
In contrast, the participation rate for those aged 15-64 is expected to keep increasing over the projection period, up by 0.9 percentage points, from 80.2% in 2023 (already an all-time high at that point) to 81.1% in 2033.
The participation rate for those aged 65+ is projected to decline from 15% in 2023 to 14% in 2033 as baby boomers continue to age. By 2033, all baby boomers will have passed the age of 67.
The participation rate of core working-aged women is expected to increase as a spillover of affordable childcare. Higher rates are also expected for older workers as the current cohort of near-retirement workers tends to have higher labour force attachment and higher average life expectancy than previous generations, allowing them to continue working longer.
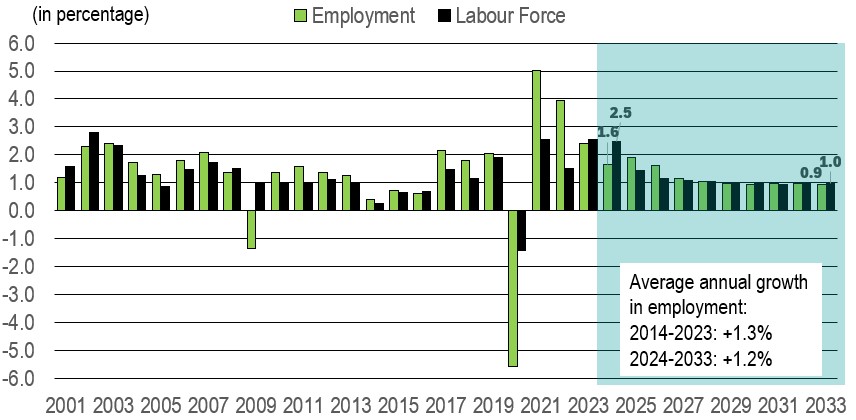
Figure 5 shows that the employment will increase in line with labour force growth.
Figure 5 : Growth in Employment and Labour Force
Sources : Statistics Canada (historical data) and ESDC 2024 COPS macroeconomic projections. The shaded area represents projections.
Text version of figure 5 : Growth in Employment and Labour Force
The total number of people in the labour force is the product of the working age population and the overall participation rate:
(Labour Force 15+ = Population 15+ x Participation Rate 15+)
Increased immigration is expected to keep supporting the pace of growth in the working-age population, the labour force and employment growth over the short- to medium-term. However, population aging and the associated decline in the overall participation rate will lead to more restrain labour force and employment growth in the longer term.
In 2023, led by the strongest population growth seen since 1957, the labour market recorded solid gains in both labour force (2.6%) and employment (2.4%). With labour force outpacing employment, the unemployment rate increased steadily during the year.
With continued expected strong population and labour force growth in 2024 and a projected slowdown in employment growth, the unemployment rate will peak in 2024. Then, employment growth is expected to outpaced labour force growth for a few years, as the economy rebounds back led by progressive interest rate cuts. As a result, the unemployment rate is projected to return to near what is considered as its natural or full employment rate by the end of 2026.
Massive retirements of baby-boomers from the labour market will continue to generate job vacancies, which will facilitate job search for new unemployed individuals, contributing to maintain the unemployment rate low.
The resulting pace of growth in the labour force is expected to average 1.2% annually over the period 2024- 2033, similar to the 1.1% recorded over the period 2014-2023.
As for employment, growth is expected to average 1.2% annually over the period 2024-2033, similar to the 1.3% recorded over the period 2014-2023.
Composition of Growth in Aggregate Demand
Canada’s real GDP is projected to rebound in 2025, as the Bank of Canada gradually lowers interest rates. In the longer-term, economic growth will be in line with potential output growth.
Figure 6 : Growth in Real GDP, Final Domestic Demand and Exports (in percentage)

Sources : Statistics Canada (historical data) and ESDC 2024 COPS macroeconomic projections. The shaded area represents projections.
Text version of figure 6 : Growth in Real GDP, Final Domestic Demand and Exports
In reaction to accelerating inflation, the Bank of Canada increased its bank rate 10 times between March 2022 and July 2023, for a cumulative increase of 475 basis points. This has led to a progressive slowdown in aggregate demand. As a result, real GDP grew by only 1.1% in 2023. Economic growth is expected to remain weak in 2024, as interest rates remain elevated and households are still facing the impact of high inflation on real disposable income.
As inflation slowly returns to the 2% target, the Bank of Canada is expected to gradually lower its bank rate resulting in more robust consumer spending and a rebound in residential investment. Business investment is also expected to strengthen, led by investment in the transportation equipment manufacturing and the energy sector. All this combined together will lead to stronger real GDP growth in 2025 and 2026.
In 2024, exports growth will be limited by the expected slowdown in the US economy and by subdued agriculture exports as a result of the adverse weather conditions that Western Canada experienced in 2023, which led to considerable reduction in stock levels. On the other hand, the completion of the Trans Mountain expansion pipeline project will add to export capacity and expand oil drilling during the second half of 2024 and into 2025. The long-term outlook for the export sector is slightly more pesimistic though. The Government of Canada's commitment to achieving the 2030 target of lowering the emissions to 40% to 45% below the 2005 levels will demand the implementation of various measures, including a reduction in annual carbon emissions levels, which will negatively impact the oil sector.
Long-term Canadian real GDP growth is expected to decelerate to around 1.7% annually, due to slower population and labour force growth and modest trend growth in the capital stock and trend labour productivity.
The resulting pace of growth in real GDP is expected to average 1.8% over the 2024 to 2033 period, with final domestic demand growing at an expected average rate of 1.9% and exports expected to average 1.8%.
Figure 7 shows that the final domestic demand growth is expected to be driven by consumer spending, residential and non-residential investment.
Figure 7 : Indexed Growth in Major Components of Final Domestic Demand

Sources : Statistics Canada (historical data) and ESDC 2024 COPS macroeconomic projections. The shaded area represents projections.
Text version of figure 7 : Indexed Growth in Major Components of Final Domestic Demand
Average Annual Growth by Component (%)
| 2014-2023 | 2024-2033 | |
|---|---|---|
| Consumer Spending | 2.0 | 2.1 |
| Goods | 1.9 | 1.6 |
| Services | 2.1 | 2.4 |
| Residential Investment | 0.2 | 3.2 |
| New Construction | 1.2 | 2.3 |
| Renovation | 0.7 | 3.1 |
| Resale (existing houses) | -1.8 | 5.2 |
| Non-Residential Investment | -0.7 | 1.3 |
| Buildings | -0.2 | 2.2 |
| Engineering Structures | -1.9 | 0.2 |
| Machinery & Equipment | -1.1 | 2.0 |
| Intellectual Property | 2.6 | 1.7 |
| Government Spending | 2.0 | 1.5 |
| Consumption | 2.1 | 1.6 |
| Investment | 1.6 | 0.9 |
Sources : Statistics Canada (historical data) and ESDC 2024 COPS macroeconomic projections.
Consumer spending is expected to keep growing at a similar rate over the projection period as it did over the past decade, mostly due to faster spending growth for services, but slower spending growth for goods. Even though there is strong population growth and a solid job market, high inflation and rising debt payments will limit household spending in the short term. As interest rates go down and inflation reaches the Bank of Canada's 2% target, real disposable income will increase, supporting spending in 2025 and 2026. While job growth will continue to help consumer spending, high mortgage debt and an aging population will slow growth in the long term.
Residential investment is projected to improve over the projection period. Due to rapid interest rate increases, residential investment dropped significantly in 2022 and 2023. However, strong population growth, driven by new non-permanent residents and higher immigration, increased the demand for housing in those two years. Interest rates are expected to gradually decrease, improving affordability somewhat. Combined with the housing shortage, this will boost residential investment in the short term. However, housing prices and mortgage rates will stay higher than pre-pandemic levels, limiting affordability and demand over the long run. A total of 2.7 million new housing units are expected between 2024 and 2033, averaging 267,000 per year.
Non-residential investment is expected to grow again, with a positive outlook in most areas. Investments in engineering structures will improve, thanks to energy and transportation projects. Growth in non-residential buildings will speed up due to large electric vehicle battery factories. After slow growth in the past decade, investments in machinery, equipment, and intellectual property will strengthen, driven by new technology (like automation and AI), a tight labor market, and the need for higher productivity over the long run.
Federal and provincial/territorial governments are facing substantive budgetary shortfalls, as such increasing pressures on public finances are expected to restrain government spending growth over the projection period.
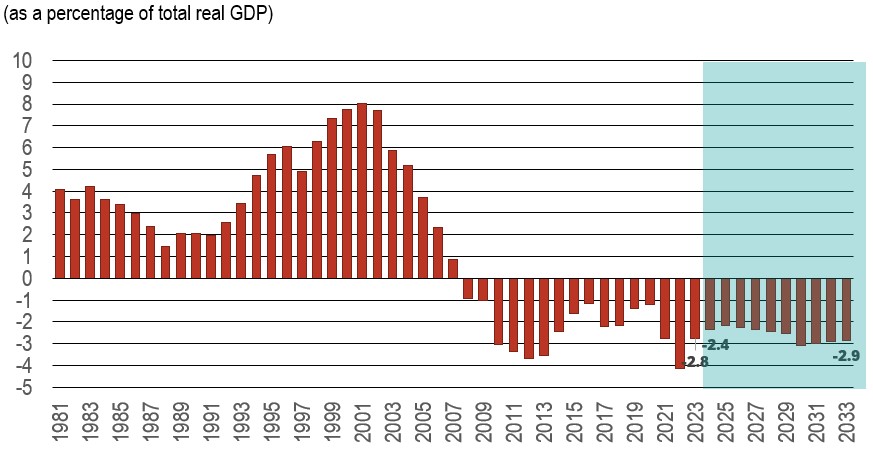
Figure 8 shows that the trade deficit is expected to decline in the short-term, but to grow over the long-term.
Figure 8 : Real Net Exports
Sources : Statistics Canada (historical data) and ESDC 2024 COPS macroeconomic projections. The shaded area represents projections.
Text version of figure 8 : Real Net Exports
Exports are anticipated to have a stronger performance than imports over the short term, while the long- term outlook for the export sector is expected to undergo significant changes. As a result, exports are projected to grow at an average annual rate of 1.6% over the projection period, slightly lower than imports that are expected to grow at a pace of 1.7%.
EXPORTS: After strong rebounds in 2022 (+3.2%) and 2023 (+5.7%), exports of goods and services are expected to slightly decline in 2024 due to a slowdown in the U.S. economy. Consumer spending will also decrease as pandemic savings run out and the effects of past interest rate hikes take hold. Exports of agricultural products will stay limited because of bad weather in Western Canada, which reduced stock levels. However, oil exports will increase as the Trans Mountain pipeline expansion boosts export capacity and drilling. In the long term, export growth will slow as the U.S. economy slows down. Additionally, Canada’s goal of reducing emissions by 40% to 45% by 2030 will require measures, including capping oil and gas production. This cap may lead to a drop in exports from these industries as some facilities may no longer be profitable to operate.
IMPORTS: After rebounding markedly in 2022 (+7.6%), growth in imports of goods and services weakened in 2023 (+1.0%), reflecting the slowdown in the Canadian economy. Looking-ahead, imports are expected to face challenges in the short-term due to weaker consumer and business spending, with modest outlooks for consumption along with machinery and equipment investment exerting downward pressures on imports. However, an anticipated easing of monetary policy is likely to stimulate consumption and investment demand, leading to an acceleration in import growth. Over the longer term, import growth is expected to moderate, in line with the slower pace of growth projected in final domestic demand.
Industrial projection
Changes in external and domestic drivers of aggregate demand are projected to lead to changes in the pace of growth of industrial output and employment, which in turn will affect occupational labour demand over the period 2024-2033.
Historical and Projected Trends in Real GDP, Employment and Productivity by Aggregate Sector
Over the period 2024-2033, output growth is projected to accelerate in manufacturing and construction, while it is expected to slow in the primary and services sectors, resulting in stable growth in total GDP relative to the period 2014-2023.
Figure 9 : Real GDP Growth by Aggregate Sector

Sources : Statistics Canada (historical data) and ESDC 2024 COPS industrial projections.
Text version of figure 9 : Real GDP Growth by Aggregate Sector
Average annual growth in total real GDP over the period 2024-2033 is projected to remain stable relative to the period 2014-2023, at 1.8% annually. However, faster growth in manufacturing and construction is expected to be offset by slightly weaker output growth in the primary and services sectors.
The expected slowdown in growth in the primary sector is mainly due to a decline in oil and gas extraction, especially in the latter half of the projection period. New federal emissions regulations and policies, such as the Clean Fuel Regulations, are likely to affect demand in industries that refine oil and process natural gas. However, growth in the other primary industries is expected to improve.
The expected growth in manufacturing is largely due to improvements in the housing market, driven by lower interest rates in the short term and positive trends in housing starts and renovations. This growth will benefit manufacturers of construction materials like wood, metal, plastic, and electrical products. Government incentives to increase and upgrade housing, along with population growth, will also support this trend. Additionally, Canada’s shift to clean energy will boost sectors involved in producing clean energy technologies, such as electric vehicles and batteries.
Real GDP in construction is expected to rise in the short term due to interest rate cuts by the Bank of Canada, which will increase housing starts and boost residential construction. In the medium term, growth will slow but remain strong, supported by ongoing clean energy projects and incentives from Canada’s Housing Plan. Canada is also set to host major facilities for producing electric vehicle batteries, clean hydrogen and ammonia, and various biofuels, which will help non-residential construction.
From 2014 to 2023, service output growth benefited from rising demand for IT services and the shift to remote work after the pandemic. While demand for IT services will continue, it’s expected to grow at a slower pace, leading to a decline in overall output growth for the services sector. However, the outlook for service industries is positive, as an aging population is likely to increase spending on services over goods. Consequently, even with a slight slowdown compared to the previous decade, the service sector’s growth is expected to outpace that of the goods-producing sector.
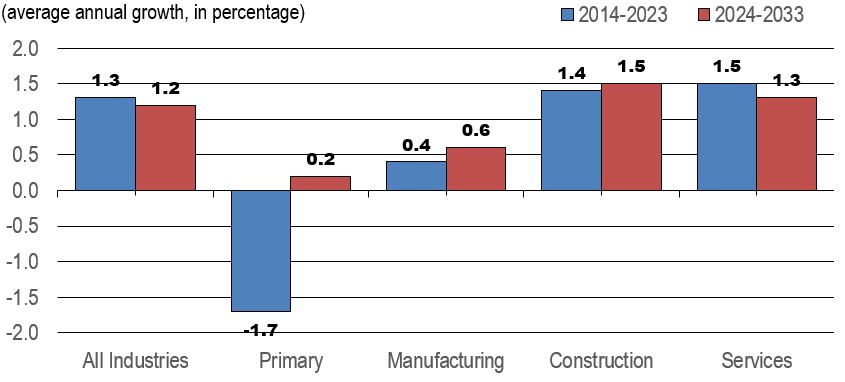
Figure 10 shows that the total employment growth is also projected to slightly decelerate over the period 2024- 2033, reflecting a slightly more modest employment growth in the services industries relative to the period 2014-2023.
Figure 10 : Employment Growth by Aggregate Sector
Sources : Statistics Canada (historical data) and ESDC 2024 COPS industrial projections.
Text version of figure 10 : Employment Growth by Aggregate Sector
Average annual growth in total employment over the period 2024-2033 is projected to slowdown modestly compared to the period 2014-2023. Renewed growth in the primary sector and faster growth in manufacturing and construction, will be slowed by slightly weaker growth in services.
After an average annual decline of 1.7% from 2014 to 2023, employment in the primary sector is expected to slightly increase by 0.2% over the projection period, even though output growth is expected to slow. The slower output growth is mostly due to oil and gas extraction, while other industries in the sector are expected to see better output growth compared to the past decade. Employment growth is predicted to come from forestry, logging, and support activities for mining, oil, and gas. However, employment is expected to fall in agriculture, fishing, hunting, trapping, and oil and gas extraction.
Manufacturing employment recorded large fluctuations over the past decade, particularly during the pandemic, but the number of workers in 2023 was higher than in 2013, resulting in a modest annual average growth of 0.4% over the whole period 2014-2023. Employment growth in the sector is expected to strengthen modestly over the projection period as a result of faster output growth. Job creation will continue, however, to be constrained by additional gains in productivity resulting from the further adoption of automation technologies and the desire of manufacturers to improve competitiveness on foreign and domestic markets. On average, manufacturing employment is projected to advance at a moderate pace of 0.6% annually over the period 2024-2033.
Employment growth in construction is expected to average 1.5% annually over the 2024-2033 period, about the same as over the last decade. While strong output growth is expected over the next decade (see previous slide) employment growth is expected to be more modest with the expectation of improvement on the productivity side (see next slide).
Employment growth in the services industries is expected to slightly decelerate over the projection period in line with the more modest pace of growth anticipated in output relative to the previous decade. Gains in employment are expected to be led by health care and computer system design. Overall, total employment in this sector is projected to increase at an average pace of 1.3% annually for the period 2024-2033, down from 1.5% over the period 2014-2023.
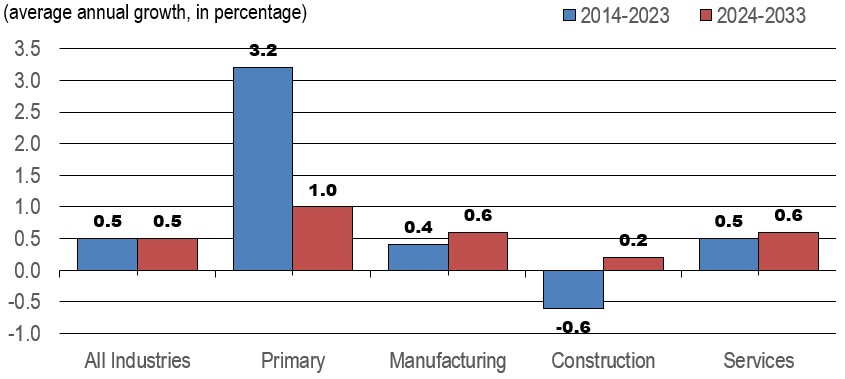
Figure 11 shows that the productivity growth is expected to weaken in the primary sector, but accelerate in the construction, manufacturing and services sectors, resulting in a similar pace of growth for the overall economy relative to the previous decade.
Figure 11 : Productivity Growth by Aggregate Sector*
Sources : Statistics Canada (historical data) and ESDC 2024 COPS industrial projections. * Note: In this document, the term productivity always refers to labour productivity.
Text version of figure 11 : Productivity Growth by Aggregate Sector*
Productivity for the whole economy is expected to grow at about the same rate as in the past ten years. Faster productivity growth in manufacturing, construction, and services will be balanced by much slower growth in the primary sector. While more investment in machinery and equipment will drive this growth, productivity is still expected to increase moderately. In 2023, investment in machinery and equipment was still slightly below pre- pandemic levels. Although it is expected to recover and grow, it will take time for the Canadian economy to fully see the benefits in productivity.
The notable slowdown anticipated in productivity growth for the primary sector largely reflects much lower investment in the oil and gas extraction industry since the sharp drop recorded in oil prices from 2014 to 2016. Although productivity growth in this industry will remain solid, it is expected to weaken significantly relative to the past decade. Productivity growth is also expected to weaken in agriculture, and support activities, while it is expected to improve in mining and fishing, and to remain unchanged in the forestry industry.
After trending up from 2014 to 2019, productivity in manufacturing fell sharply in 2020, and while it increased in 2021 and 2022, it fell again in 2023, remaining below its pre-pandemic level. Productivity is expected to slowly recover and increase at a somewhat modest pace during most of the projection period, averaging 0.6% annually, driven by faster investment growth in the sector and further developments in robotics, 3D printing, augmented reality applications and other automation technologies.
A small annual increase of 0.2% is anticipated in productivity in construction, following an annual decline of 0.6% over the past decade. Even if the construction industry is highly labour intensive, particularly in the residential component, programs such as the Construction Sector Digitalization and Productivity Challenge have been put in place to accelerate innovation, digitize construction processes and promote advanced construction practices.
In services, gains in productivity will be driven by rapid advances in digital and cognitive technologies, such as mobile applications, smart systems, machine learning, artificial intelligence and autonomous transportation. Under a tight labour market, those technologies are expected to stimulate productivity and increase the number of tasks that could potentially be automated across a wide range of occupations, including human-centric jobs and those requiring a higher level of education.
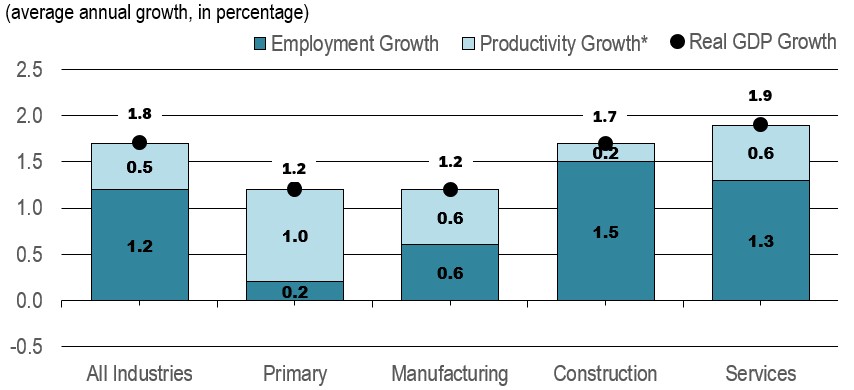
Figure 12 shows that the productivity is expected to account for the largest part of GDP growth in the primary industries, and half of GDP growth in the manufacturing sector. Inversely, employment is expected to account for the majority of GDP growth in the construction and services sectors.
Figure 12 : Decomposition of Real GDP Growth by Aggregate Sector, Projection 2024-2033
Sources : Statistics Canada (historical data) and ESDC 2024 COPS industrial projections.
* Note: In this document, the term productivity always refers to labour productivity.
Text version of figure 12 : Decomposition of Real GDP Growth by Aggregate Sector, Projection 2024-2033
Productivity growth is expected to account for half of real GDP growth in manufacturing over the period 2024-2033, compared to 83% in the primary sector, 32% in services and 12% in construction. For the overall economy, this proportion is expected to be 28%.
The significant shares of GDP growth attributable to productivity in the primary and manufacturing sectors reflect the fact those two sectors are generally more capital intensive. Employment is largely composed of routine tasks that can be increasingly automated with new applications enabled by technological innovations. These two sectors are also strongly exposed to international competition and globalization. Productivity allows firms to lower unit production costs and improve competitiveness on foreign and domestic markets.
On the other hand, the lower shares of GDP growth attributable to productivity in the construction and services sectors reflect the fact those two sectors are generally more labour intensive. Employment is mainly composed of human-centric occupations involving tasks and skills that are less likely to be performed or complemented by technology. These two sectors are also largely oriented towards the domestic market and less exposed to international competition and import penetration.
Figure 13 shows that the long-term shifts in the industrial structure are projected to continue over the next decade, albeit at a much slower pace than in the past.
Figure 13 : Distribution of Real GDP and Employment by Aggregate Sector

Sources : ESDC 2024 COPS industrial projections. The shaded area represents projections.
Text version of figure 13a : Distribution of Real GDP by Aggregate Sector
Text version of figure 13b : Distribution of Employment by Aggregate Sector
In terms of real GDP and employment, the relative importance of the services sector is expected to increase modestly, with average growth rates in real output and employment slightly exceeding those of the overall economy. By 2033, the services sector is projected to account for 75% of total production and 80% of overall employment, up 1.0 and 0.7 percentage points respectively from their 2023 shares.
The remaining three sectors (primary, construction and manufacturing) are projected to account for 25% of total output and 20% of overall employment by the end of the projection period.
- The relative importance of the primary and manufacturing sectors is projected to decline marginally in terms of both production and employment.
- The relative importance of the construction sector in production and employment is expected to remain stable.
As a result, the services sector is expected to account for 85% of total employment creation from 2023 to 2033.
| 2003 | 2013 | 2023 |
2033 (Projection) |
Variation 2023-2033 |
|
|---|---|---|---|---|---|
Primary |
609.2 (3.9%) |
690.8 (3.9.%) |
582.8 (2.9%) |
593.1 (2.6%) |
+10.3 (0.4%) |
Manufacturing |
2,277.4 (14.5%) |
1,732.6 (9.8%) |
1,811.9 (9.0%) |
1,926.4 (8.5%) |
+114.4 (4.4%) |
Construction |
910.6 (5.8%) |
1,377.2 (7.8%) |
1,582.5 (7.8%) |
1,829.4 (8.0%) |
+246.9 (9.5%) |
Services |
11,733.0 (74.9%) |
13,779.6 (77.8%) |
16,038.9 (79.5%) |
18,246.4 (80.2%) |
+2,207,.6 (85.2%) |
Total |
15,660.8 (100.0%) |
17,712.2 (100.0%) |
20,170.9 (100.0%) |
22,760.8 (100.0%) |
+2,589.9 (100.0%) |
Sources : ESDC 2024, COPS industrial projections.
Employment in the services sector is projected to increase by 2.2 million between 2023 and 2033, about the same as the 2.3 million observed during the previous ten years. This sector is expected to account for 85.2% of all employment gains during the projection period.
In the construction sector, employment is projected to expand by 246,900 between 2023 and 2033, compared to 205,300 in the previous ten years. The sector is expected to employ more than 1.8 million workers by 2033, accounting for 9.5% of the projected employment gains.
After increasing by 79,400 between 2013 and 2023, employment in the manufacturing sector is projected to increase at a faster pace (+114,400, accounting for 4.4% of total employment gains) over the projection period, reaching more than 1.9 million workers in 2033. However, because the average rate of growth in employment is expected to remain below that of the overall economy, the share of the sector in total employment will continue to decline, standing at 8.5% in 2033, its lowest share on record since labour force data were first published in 1976.
In the primary sector, employment is projected to pick up modestly (+10,300) between 2023 and 2033, following a decrease of 108,000 between 2013 and 2023, as a result of major job losses in 2014-2016 (oil price shock) and 2020-2021 (COVID-19 pandemic). The sector is expected to employ 593,100 workers by the end of the projection period, accounting for 2.6% of overall employment in 2033, and 0.4% of total job creation during the projection period.
Comparisons of Employment Projections across Industries
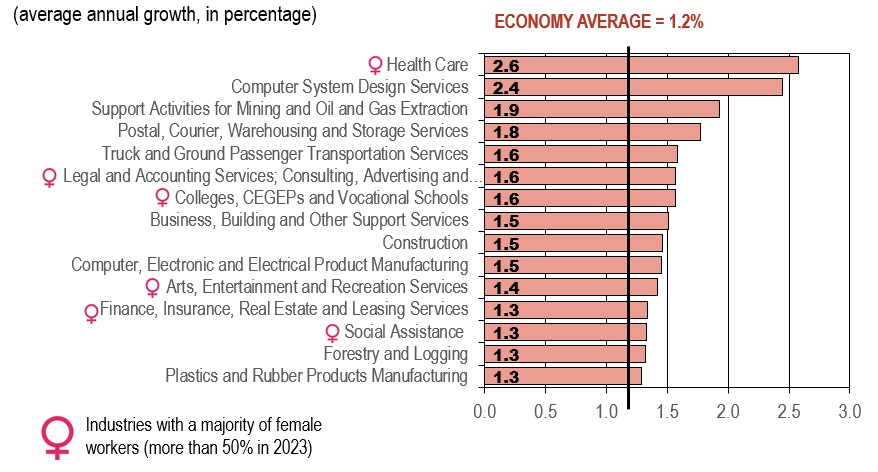
Figure 14 shows that the industries that are projected to experience the strongest growth in employment.
Figure 14 : Employment Growth by Industry, Projection 2024-2033
Sources : ESDC 2024 COPS industrial projections.
Text version of figure 14 : Employment Growth by Industry, Projection 2024-2033
Industries projected to experience the strongest growth in employment (i.e. above 1.2% annually) are generally characterized by a high degree of labour intensity and human-centric jobs (interpersonal and cognitive skills, with low productivity growth). Below are some of the key factors expected to support output and job creation in those industries:
- Strong demand for health care, stimulated by population aging, the universal dental care program, and support by different levels of governments in Canada to help retain the health care workforce;
- Rapid innovations in information and communication technologies (ICT) and the need for businesses to continuously upgrade their ICT infrastructure to remain secure and competitive (computer systems);
- Mining services firms will assist Canadian mining operators with prospective exploration and drilling activities needed to support the production of critical minerals related to the clean energy transition;
- Continued growth in e-commerce and the associated demand for postal, courier, warehousing and storage services;
- The faster pace of growth anticipated in manufacturing shipments (truck transportation) and additional investment in public and urban transit systems (ground passenger transportation);
- Growing demand for professional advice on planning, logistics, mergers, acquisitions, environmental regulation and implementation of new technologies (legal, accounting and consulting services);
- The positive impacts of domestic demographics on enrollment rates in colleges, CEGEPs and vocational schools;
- The growing number of firms across the economy that choose to outsource administrative and support functions in order to remain focused on their core activities and increase operation efficiency;
- Global clean energy transition aimed at reducing greenhouse gas emissions that will increase demand for greener, more energy-efficient buildings, which will drive the adoption of smart home technology (computer, electronic and electrical product manufacturing);
- Increase in international and domestic tourists, the 2026 FIFA World Cup, and the continued retirement of baby boomers, among others, will support the arts, entertainment and recreation industry.
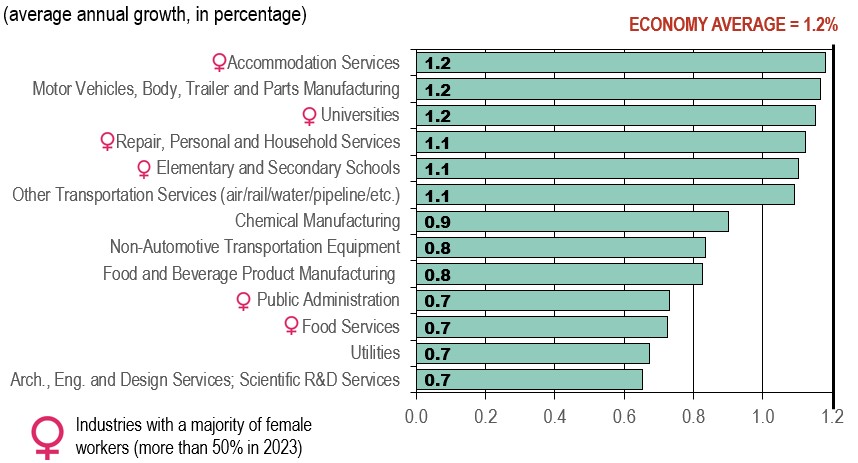
Figure 15 shows that the industries that are projected to experience moderate growth in employment.
Figure 15 : Employment Growth by Industry, Projection 2024-2033
Sources :ESDC 2024 COPS industrial projections.
Text version of figure 15 : Employment Growth by Industry, Projection 2024-2033
Industries projected to experience moderate growth in employment (i.e. between 0.6% and 1.2% annually) are also among those projected to experience moderate growth in output and/or those where productivity growth is expected to account for a significant part of real GDP growth.
This group includes four manufacturing industries, six commercial services industries, three public related services and utilities (which is a good-producing industry).
Despite the fact that some of these industries are expected to have strong growth in production, job creation is expected to be restrained by the following factors:
- Increased automation and rapid advances in digital and cognitive technologies;
- The need to find new ways of delivering services and replace labour with capital, in response to demographic pressures on labour supply in Canada;
- The need to lower labour costs and increase productivity in manufacturing industries in response to the intensification of global competition;
- Demographic factors and enrolment rates impacting educational services related industries elementary and secondary school, and university (annual employment growth is expected to be only slightly below the average);
- Federal and provincial commitment to reduce budget deficit which will limit the growth in public administration employment.
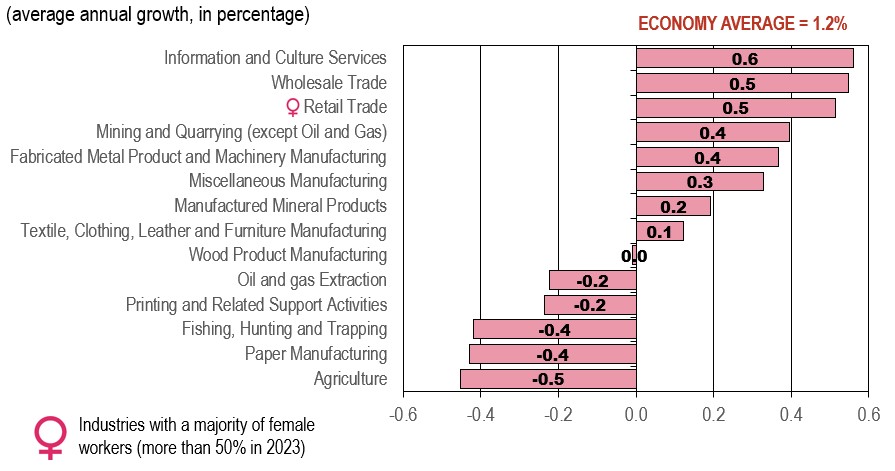
Figure 16 shows that the industries that are projected to experience the weakest growth or declines in employment.
Figure 16 : Employment Growth by Industry, Projection 2024-2033
Sources : ESDC 2024, COPS industrial projections.
Text version of figure 16 : Employment Growth by Industry, Projection 2024-2033
Industries projected to experience the weakest growth or declines in employment (i.e. below 0.6% annually) are also those projected to experience among the weakest growth in output and/or those where productivity growth is expected to account for a large part (or the totality) of real GDP growth
This group is essentially composed of manufacturing and primary industries, with the exception of three services-producing industries that are projected to have the three strongest growth in the group. Many of those industries have experienced a stagnation or a declining trend in output and/or employment over the past several years, such as agriculture, printing, textiles, clothing, furniture, paper and fishing. This group of industries is expected to face similar challenges than those experienced in the past, as well as new hurdles, including:
- The intensification of foreign competition from low cost-producers in the manufacturing sector;
- Lower demand for paper and printing due to the growing use of electronic media and telework;
- Continuation of recent trend in employment for manufacturing of wood, bricks, windows, furniture, appliances and other products led by increasing need to remain competitive and automate production;
- Fish supply constraints (allowable annual cuts and various quotas on fish species);
- Difficulties to attract workers in agriculture and out-migration from rural/fishing communities; and
- Environmental regulation and limited production and pipeline capacity in oil and gas extraction.
Productivity growth is expected to account for a large share (or the totality) of output growth in most industries listed on the chart, restraining employment growth (or resulting in employment declines) over the projection period. Employment in those industries is largely composed of routine tasks that can be increasingly automated with new applications enabled by technological progress. The solid pace of growth anticipated in investment related to machinery and equipment (M&E) is expected to increase the amount of capital and technology available per worker, boosting productivity over the long-term. For example, advanced robotics, augmented reality, 3D printing and the Internet of Ihings (IoT) are among the most innovative technologies that are expected to transform manufacturing operations and improve productivity over the forecast horizon. Significant job losses in oil and gas extraction will continue to be less labour intensive in what concerns to the exploitation of the oil sands due to advancements in extractive technologies and modular facility design. Additional job losses in fishing and paper primarily reflects further declines in output.
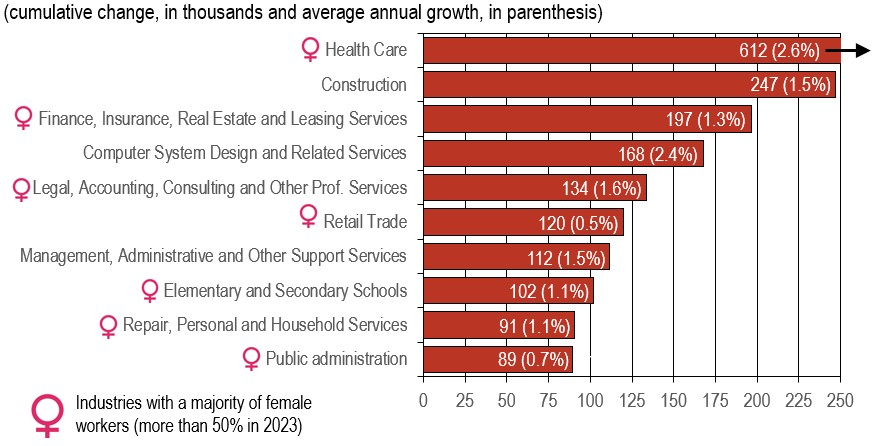
Figure 17 shows that th following ten industries will account for more than 72% of the total increase projected in employment across Canada over the period 2024-2033.
Figure 17 : Employment Change by Industry, Projection 2024-2033
Sources : ESDC 2024 COPS industrial projections.
Text version of figure 17 : Employment Change by Industry, Projection 2024-2033
Among the 42 industries covered by COPS, 10 industries will account for more than 72% of the total increase projected in employment across Canada over the period 2024-2033.
Future changes in the level of employment by industry can be decomposed in two components:
- The rate of growth projected in employment for the industry;
- The current number of workers in the industry (i.e. the size of the industry).
This means that the ten industries projected to experience the largest increases in the number of workers are not necessarily those projected to experience the strongest growth rates in employment.
For example, the retail trade industry is projected to experience among the largest increases in the number of workers, despite moderate growth rates in employment (Figure 16). This simply reflects the large size of this industry relative to other industries.
Gender Analysis
The industrial projections cannot be performed by gender, but the historical data provide the distribution of men and women of industrial and occupational employment.
The data show that female workers are mostly concentrated in services. This is because women are more likely than men to work in services-producing industries, while men are more likely than women to work in goods-producing industries.
In 2023, 90% of female workers were employed in the services industries, compared to 70% for male workers. Inversely, 30% of male workers worked in the primary, manufacturing or construction industries, compared to 10% for female workers.
Among the thirteen industries with a majority of female workers, six industries are expected to post strong growth in employment (Figure 14), six are expected to post moderate growth in employment (Figure 15), and only one is expected to post weak growth in employment (Figure 16).
Among the ten industries projected to experience the largest increases in the number of workers (Figure 17), seven industries are dominated by female workers, as women tend to operate in services industries with a high number of workers.
Impact of the Emissions Cap
In December 2023, the Government of Canada announced its intention to implement a nationwide cap-and-trade system covering the upstream oil and gas sector. The Cap would constrain sectoral greenhouse gas (GHG) emissions in line with Canada’s 2030 climate goals. These production impacts are included in the long-term projection, affecting oil and gas production in Alberta, British Columbia, Newfoundland and Labrador, and Saskatchewan.
- In the projection, it is assumed that the sector will achieve roughly 5 Mt CO2e of GHG reductions resulting from continued improvement in production efficacy (emissions per unit of output) and a 20 Mt C02e of emission reductions from actions related to abatement of methane associated with fugitive and venting related sources.
- To get the remainder of the emissions in the sector under the cap will require significant investments in carbon capture and storage (CCS) and/or a reduction in production activity and resulting emissions.
- An analysis comparing the financial impact of investing in CCS (carbon capture and storage) technology versus reducing production to meet emission caps indicated that curtailing production results in higher asset values than investing in CCS for emissions reduction. This suggests that, from a purely financial perspective, reducing output might be a more attractive option than investing in CCS.
- Aside from the lower asset values, analysis revealed other factors that will tilt the scales towards production shut-ins rather than CCS investments.
- With that in mind, the projection assumes that investment in CCS technology alone will not be enough to reach the 2030 target and production cut in some industries, most notably oil and gas extraction, will be necessary.