Canadian Occupational Projection System (COPS)
Industrial Projections (2022-2031)
NOTE: The current industrial projections were completed in spring 2022, i.e. before expectations about the risk of an eventual recession in 2023. However, the focus of the COPS projections is on long-term trends in industrial and occupational labour markets, not on short-term developments. These long-term trends are not expected to be affected markedly by an eventual recession as its impacts are expected to be temporary and of short duration.
| Changes in external and domestic drivers of aggregate demand are projected to lead to changes in the pace of growth of industrial output and employment, which in turn will affect occupational labour demand over the period 2022-2031. See the Macroeconomic Outlook (2022-2031) for more information. |
Historical and Projected Trends in Real GDP, Employment and Productivity by Aggregate Sector
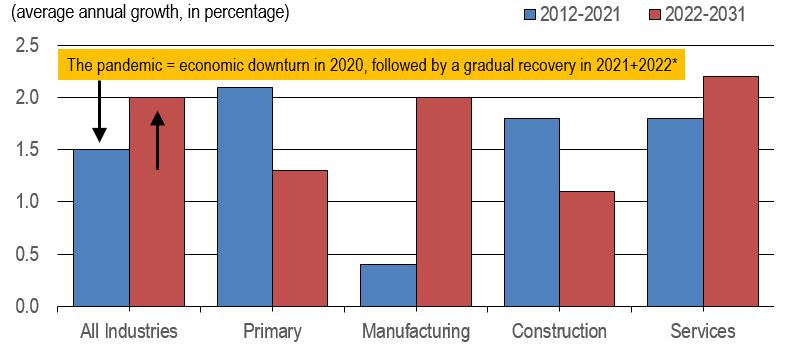
Figure 1 presents growth in real gross domestic product (GDP) by aggregate sector over the periods 2009-2018 and 2019-2028. It shows that over the period 2019-2028, real GDP growth is projected to slow in the primary and construction sectors, accelerate in manufacturing and remain essentially unchanged in services, resulting in similar growth in total GDP relative to the period 2009-2018.
Figure 1: Real GDP Growth by Aggregate Sector
Sources: Statistics Canada (historical) and ESDC 2022 COPS industrial outlook.
Note: The significant acceleration projected in total GDP growth partly reflects the large fluctuations in output attributable to the pandemic, which have lowered average growth for the period 2012-2021 and boosted average growth for the period 2022-2031.
Text version of Figure 1: Real GDP Growth by Aggregate Sector
Average annual growth in total real GDP over the period 2022-2031 is projected to accelerate relative to the period 2012-2021, driven by faster growth in manufacturing and services, particularly in the short-term as the economy recovers from the pandemic. In contrast, output growth is expected to weaken significantly in the primary and construction sectors over the projection period.
The slowdown projected in output growth for the primary sector is primarily driven by the weaker pace of growth expected in oil and gas extraction, due to limited production and pipeline capacity, the trend towards electrification and clean energy, and the federal government’s 2030 Emissions Reduction Plan. Output growth in mining is also projected to weaken somewhat relative to the previous ten years, while it is expected to straighten in support activities for mining, oil and gas extraction (after many years of declines in exploration and drilling activities) and improve modestly in agriculture, forestry and fishing.
The strong acceleration projected in output growth for manufacturing reflects the fact that this sector was severely affected by widespread lockdowns at the onset of the COVID-19 pandemic. Indeed, the Canadian production of manufactured goods plunged by 9.7% in 2020 before rebounding by 4.6% in 2021, leaving the output well below pre-pandemic levels and lowering the average annual pace of growth to 0.4% only for the full period 2012-2021. Manufacturing GDP is expected to fully recover by 2022 and continue to experience solid growth in the first half of the projection period, driven by renewed growth in exports as the global economy gradually recovers from the pandemic and supply chain disruptions taper off. The resulting pace of growth in output is projected to average 2.0% annually over the period 2022-2031.
After peaking in 2021, real GDP in construction is expected to keep growing at a solid pace in 2022, before declining in 2023-2024 and experiencing subdued growth thereafter. This slowdown relative to the previous decade reflects the small decline anticipated in residential investment as the surge in housing prices, higher mortgage rates and changing demographics are expected to reduce new home construction and resale activity, restraining growth in renovation spending. However, a better outlook is expected for non-residential investment, reflecting faster growth in investment related to the construction of commercial, industrial or institutional buildings and renewed growth in investment related to engineering structures.
The acceleration projected in output growth for services partly reflects the fact that a number of industries have yet to fully recover from the pandemic (travel, tourism, hotels, restaurants, bars, recreation and personal services). Household cumulated a large amount of savings and significant pent-up demand for services as consumption patterns shifted towards goods during the pandemic. Over the longer term, population aging is also expected to increase the share of services and lower the share of goods in consumer spending.
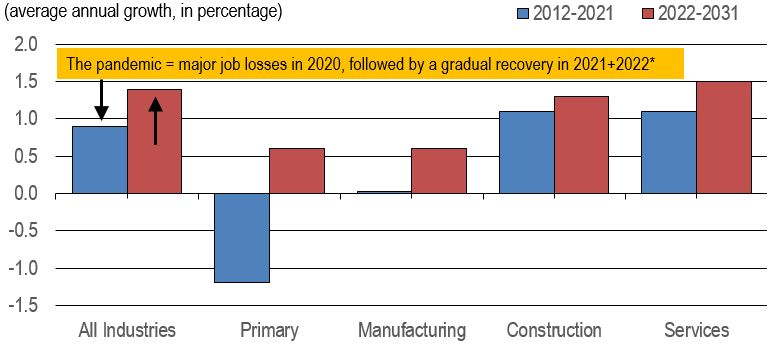
Figure 2 presents employment growth by aggregate sector over the periods 2012-2021 and 2022-2031. It shows that total employment growth is also projected to accelerate over the period 2022-2031, reflecting a better outlook in all major sectors of the economy relative to the period 2012-2021, due to solid employment gains in the short-term (recovery to pre-pandemic levels).
Figure 2: Employment Growth by Aggregate Sector
Sources: Statistics Canada (historical) and ESDC 2022 COPS industrial outlook.
Note: TThe significant acceleration projected in total employment growth partly reflects the large fluctuations attributable to the pandemic, which have lowered average growth for the period 2012-2021 and boosted average growth for the period 2022-2031.
Text version of Figure 2: Employment Growth by Aggregate Sector
In the projection, productivity for the overall economy is increasing at a similar pace than the past ten years, as faster productivity growth in manufacturing is expected to be accompanied by slower productivity growth in the primary sector and slightly lower productivity in construction. Productivity growth in services is projected to remained unchanged. While additional increases in productivity will be primarily driven by the sharp straightening anticipated in investment related to machinery and equipment (see the macroeconomic outlook), there are reasons to believe that productivity will not be overly strong. The current level of M&E investment still remains below the levels observed prior to the pandemic and it may take some time for the Canadian economy to recover to the point where it will lead to stronger productivity growth.
The notable slowdown anticipated in productivity growth for the primary sector largely reflects much lower investment from the oil and gas extraction industry since the sharp drop recorded in oil prices from 2014 to 2016. Although productivity growth in this industry will remain solid, it is expected to weaken significantly relative to the past decade. Productivity growth is also expected to weaken in agriculture, mining and fishing, while it is expected to remain low in support activities and negative in forestry. In many instances, slower productivity growth can be partly explained by the fact that a large part of the production process has already been automated in the previous decades, leaving less room for further improvement in productivity.
After trending up from 2012 to 2019, productivity in manufacturing fell sharply in 2020-2021, lowering the annual average growth rate to only 0.4% for the whole period 2012-2021. However, productivity is expected to fully recover in 2022 and continue to increase at a solid pace during most of the projection period, averaging 1.4% annually, driven by faster investment growth in the sector and further developments in robotics, 3D printing, augmented reality applications and other automation technologies.
The small decline anticipated in productivity for construction will mainly occur in the short-term as a result of lower output in the sector. Over the longer term, productivity growth should return to positive territory, with output growth exceeding employment growth. But productivity gains are expected to remain relatively modest, as construction activities are highly labour intensive, particularly in the residential component.
In services, additional gains in productivity will be driven by rapid advances in digital and cognitive technologies, such as mobile applications, smart systems, machine learning, artificial intelligence and autonomous transportation. Under a very tight labour market, those technologies are expected to stimulate productivity and increase the number of tasks that could potentially be automated across a wide range of occupations, including human-centric jobs and those requiring a higher level of education.
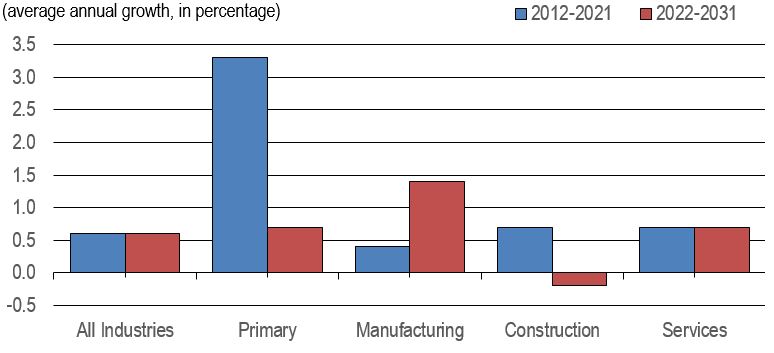
Figure 3 presents the productivity growth is expected to weaken in the primary and construction sectors, accelerate in manufacturing and remain unchanged in services, resulting in a similar pace of growth for the overall economy relative to the previous decade.
Figure 3: Productivity Growth by Aggregate Sector*
Sources: Statistics Canada (historical) and ESDC 2022 COPS industrial outlook.
* Note: In this document, the term productivity always refers to labour productivity.
Text version of Figure 3: Productivity Growth by Aggregate Sector
In the projection, productivity for the overall economy is increasing at a similar pace than the past ten years, as faster productivity growth in manufacturing is expected to be accompanied by slower productivity growth in the primary sector and slightly lower productivity in construction. Productivity growth in services is projected to remained unchanged. While additional increases in productivity will be primarily driven by the sharp straightening anticipated in investment related to machinery and equipment (see the macroeconomic outlook), there are reasons to believe that productivity will not be overly strong. The current level of M&E investment still remains below the levels observed prior to the pandemic and it may take some time for the Canadian economy to recover to the point where it will lead to stronger productivity growth.
The notable slowdown anticipated in productivity growth for the primary sector largely reflects much lower investment from the oil and gas extraction industry since the sharp drop recorded in oil prices from 2014 to 2016. Although productivity growth in this industry will remain solid, it is expected to weaken significantly relative to the past decade. Productivity growth is also expected to weaken in agriculture, mining and fishing, while it is expected to remain low in support activities and negative in forestry. In many instances, slower productivity growth can be partly explained by the fact that a large part of the production process has already been automated in the previous decades, leaving less room for further improvement in productivity.
After trending up from 2012 to 2019, productivity in manufacturing fell sharply in 2020-2021, lowering the annual average growth rate to only 0.4% for the whole period 2012-2021. However, productivity is expected to fully recover in 2022 and continue to increase at a solid pace during most of the projection period, averaging 1.4% annually, driven by faster investment growth in the sector and further developments in robotics, 3D printing, augmented reality applications and other automation technologies.
The small decline anticipated in productivity for construction will mainly occur in the short-term as a result of lower output in the sector. Over the longer term, productivity growth should return to positive territory, with output growth exceeding employment growth. But productivity gains are expected to remain relatively modest, as construction activities are highly labour intensive, particularly in the residential component.
In services, additional gains in productivity will be driven by rapid advances in digital and cognitive technologies, such as mobile applications, smart systems, machine learning, artificial intelligence and autonomous transportation. Under a very tight labour market, those technologies are expected to stimulate productivity and increase the number of tasks that could potentially be automated across a wide range of occupations, including human-centric jobs and those requiring a higher level of education.
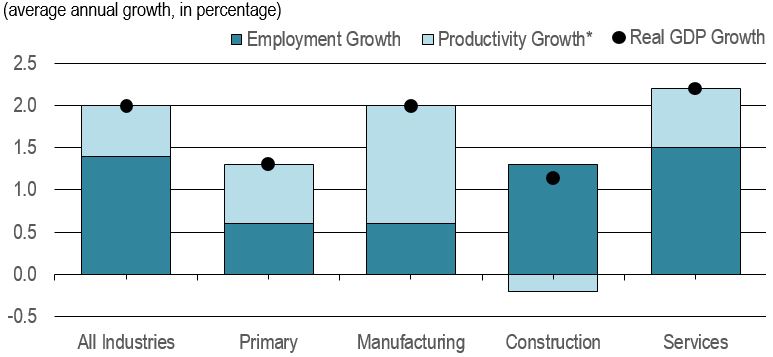
Figure 4 presents the decomposition of real GDP growth into employment and productivity growth by aggregate sector over the projection period. It shows that productivity is expected to account for the largest part of GDP growth in manufacturing and about half of GDP growth in the primary sector. Inversely, employment is expected to account for the totality of GDP growth in construction and most of GDP growth in services.
Figure 4: Decomposition of Real GDP Growth by Aggregate Sector, Projection 2022-2031
Sources: Statistics Canada (historical) and ESDC 2022 COPS industrial outlook.
* Note: In this document, the term productivity always refers to labour productivity.
Text version of Figure 4: Decomposition of Real GDP Growth by Aggregate Sector, Projection 2022-2031
Productivity growth is expected to account for 70% of real GDP growth in manufacturing over the period 2022-2031, compared to 54% in the primary sector, 32% in services and 0% in construction (in fact, construction is projected to experience notable declines in productivity in 2022-2023-2024, followed by very modest gains thereafter, resulting in negative productivity growth for the entire projection period). For the overall economy, this ratio is expected to be 30%.
The significant shares of GDP growth attributable to productivity in the primary and manufacturing sectors reflect the fact those two sectors are generally more capital intensive. Employment is largely composed of routine tasks that can be increasingly automated with new applications enabled by technological innovations. These two sectors are also strongly exposed to international competition and globalization. Productivity allows firms to lower production costs and improve competitiveness on foreign and domestic markets.
Inversely, the lower shares of GDP growth attributable to productivity in the construction and services sectors reflect the fact those two sectors are generally more labour intensive. Employment is mainly composed of human-centric occupations involving tasks and skills that are less likely to be performed or complemented by technology. These two sectors are also largely oriented towards the domestic market and less exposed to international competition and import penetration.
Figure 5 presents the distribution of real GDP and employment by aggregate sector. It shows that long-term shifts in the industrial structure are projected to continue over the next decade, albeit at a much slower pace than in the past.
Figure 5: Distribution of Real GDP and Employment by Aggregate Sector
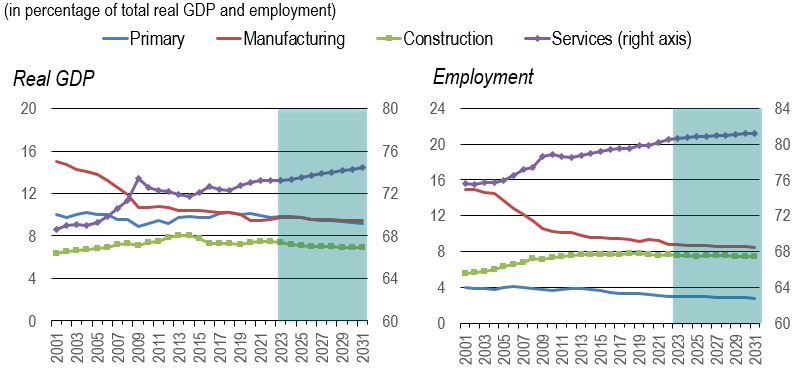
Sources: Statistics Canada (historical) and ESDC 2022 COPS industrial outlook. Shaded area = projections.
Text version of Figure 5: Distribution of Real GDP and Employment by Aggregate Sector
Long-term shifts in the industrial structure of the Canadian economy are projected to continue over the period 2022-2031, albeit at a slower pace than during the previous two decades.
In terms of real GDP and employment, the relative importance of the services sector is expected to increase modestly, with average growth rates in real output and employment slightly exceeding those of the overall economy. By 2031, the services sector is projected to account for 75% of total production and 81% of overall employment.
The remaining three sectors (primary, construction and manufacturing) would account for 25% of total output and 19% of overall employment by the end of the projection period.
- The relative importance of the primary and construction sectors is projected to decline marginally in terms of both production and employment.
- The relative importance of the manufacturing sector in production is expected to remain stable while its share of employment is expected to keep declining, albeit at a slower pace than the previous ten years.
Table 1 presents the employment level (in thousands) and its distribution by aggregate sector in 2001, 2011, 2021 and 2031. It shows that the employment distribution is projected to shift somewhat further towards the services sector, which is expected to account for 88% of total job creation from 2021 to 2031.
| 2001 | 2011 | 2021 |
2031 (Projection) |
Change 2021-2031 |
|
|---|---|---|---|---|---|
Primary |
600.2 (4.0%) |
647.7 (3.8%) |
576.5 (3.1%) |
611.6 (2.8%) |
+35.1 (1.2%) |
Manufacturing |
2,222.8 (14.9%) |
1,730.1 (10.1%) |
1,735.5 (9.2%) |
1,840.0 (8.5%) |
+104.5 (3.7%) |
Construction |
825.1 (5.5%) |
1,286.8 (7.5%) |
1,433.5 (7.6%) |
1,625.8 (7.5%) |
+192.3 (6.8%) |
Services |
11,289.0 (79.6%) |
13,508.1 (78.7%) |
15,117.9 (80.1%) |
17,629.3 (81.2%) |
+2,511.4 (88.3%) |
Total |
14,937.1 (100.0%) |
17,172.7 (100.0%) |
18,862.1 (100.0%) |
21,706.7 (100.0%) |
+2,843.6 (100.0%) |
Sources: Statistics Canada (historical) and ESDC 2022 COPS industrial outlook.
More precisely, Table 1 shows that:
- The sectoral distribution of employment is projected to shift somewhat further towards the services.
- Employment in the services sector is projected to increase by 2.5 million between 2021 and 2031, up from 1.6 million during the previous ten years. With 17.6 million workers by the end of the projection period, this sector is expected to account for 81.2% of total employment, up from 80.1% in 2021.
- In the construction sector, employment is projected to expand by 192,300 between 2021 and 2031, compared to 146,700 in the previous ten years. The sector is expected to employ more than 1.6 million workers by 2031, accounting for 7.5% of overall employment, slightly down from 7.6% in 2021.
- After increasing marginally (+5,400) between 2011 and 2021, employment in the manufacturing sector is projected to increase at a much faster pace (+104,500) over the projection period, reaching more than 1.8 million workers in 2031. However, because the average rate of growth in employment is expected to remain below that of the overall economy, the share of the sector in total employment will continue to decline, standing at 8.5% in 2031, its lowest share on record since labour force data were first published in 1976.
- In the primary sector, employment is projected to pick up modestly (+35,000) between 2021 and 2031, following a decrease of 71,200 between 2011 and 2021, as a result of major job losses in 2014-2016 (oil price shock) and 2020-2021 (COVID-19 pandemic). The sector is expected to employ 611,600 workers by the end of the projection period, accounting for 2.8% of overall employment in 2031, down from 3.1% in 2021.
- The services sector is projected to account for 88% of total job creation between 2021 and 2031, followed distantly by construction (6.8%), manufacturing (3.7%) and the primary sector (1.2%).
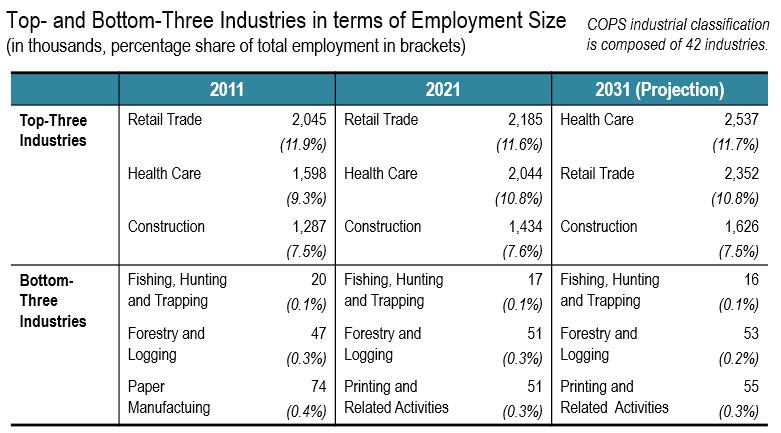
Table 2 presents the top- and bottom-three industries in terms of employment size for the years 2011, 2021 and 2031. This table shows that only small shifts are projected in the employment distribution at the detailed industry level
Table 2: Top- and Bottom-Three Industries in Terms of Employment
Sources: Statistics Canada (historical) and ESDC 2022 COPS industrial outlook.
Text version of Table 2: Top- and Bottom-Three Industries in Terms of Employment
The distribution of employment among the 42 industries covered by COPS is projected to be little changed between 2021 and 2031.
The three largest employers are projected to remain the same, although the first and second positions are expected to be reversed:
Health care is projected to become the largest employer with more than 2.5 million workers by 2031, surpassing retail trade by 185,000 workers. Construction is expected to remain in third position with about 1.6 million workers.
With a total of 6.5 million workers by the end of the projection period, those three industries are expected to account for 30% of overall employment.
The smallest employers are also projected to remain unchanged, with fishing, hunting and trapping; forestry and logging; and printing and related support activities as the bottom-three industries:
By 2031, those three industries are expected to account for only 0.6% of total employment with 55,000 workers in printing and related support activities, 53,000 in forestry and logging, and 16,000 in fishing, hunting and trapping.
Projections for Real GDP, Employment and Productivity in the Primary, Manufacturing and Services Industries
Figure 6 presents real GDP and employment growth among the primary industries over the projection period. It shows that the primary sector, support activities are projected to show the strongest growth in real GDP and employment. Output growth will also be solid in agriculture but relatively weak in mining and forestry. Employment is expected to contract in oil/gas extraction and fishing.
Figure 6: Real GDP and Employment Growth: Primary Industries, Projection 2022-2031
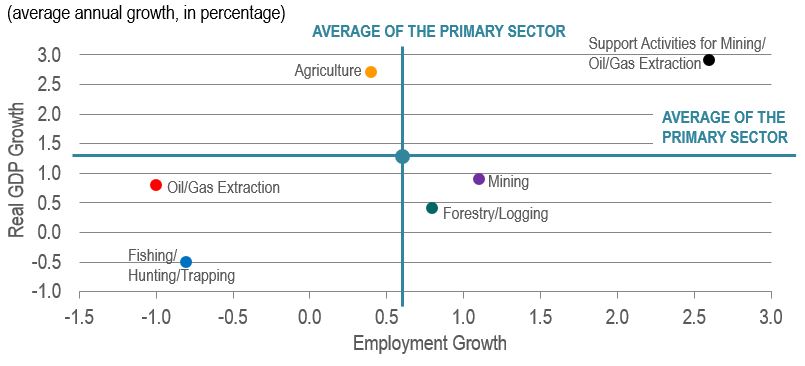
Source: ESDC 2022 COPS industrial outlook.
Text version of Figure 6: Real GDP and Employment Growth: Primary Industries, Projection 2022-2031
After being negatively affected by major investment cutbacks in the energy sector (largely due to the oil price downturn of 2014-2016), real GDP and employment in support activities for mining, oil and gas extraction are projected to straighten and show the strongest growth rates within the primary sector over the period 2022-2031. A large part of the growth is expected to be driven by notable increases in drilling activity in the short-term in response to higher oil prices. Over the longer-term, growth is expected to slow (due to weaker prospects in oil and gas extraction) and to shift towards mining support/exploration activity (partly driven by the federal government’s Critical Mineral Strategy).
Output growth is projected to be more modest and relatively similar in both mining and oil and gas extraction. These two industries are expected to benefit from the rise in commodity prices and the global realignment of supply chains resulting from the Russia-Ukraine conflict. The mining industry is also expected to benefit from the federal government commitment ($3.8 billion) to prioritize the development of 31 critical key minerals, many of them being used in the production of clean energy. However, long delays between exploration and production will restrict growth in certain areas of mining, while environmental commitments and limited production and pipeline capacity will restrict growth in oil and gas extraction. Lower productivity is expected to result in moderate employment growth in mining. Inversely, higher productivity is expected to result in employment declines in oil and gas extraction.
Real GDP in agriculture is projected to keep growing at a solid pace over the next decade, especially in the short-term, as production recovers from a sharp decline in 2021 resulting from severe droughts in Western Canada and flooding in British Columbia. Over the longer-term, robust global demand will continue to maintain high prices and support exports. The slight acceleration in output growth from the last decade is expected to lead to a modest rebound in employment, although recruitment difficulties and additional gains in productivity will continue to restrain job creation, leaving employment below its pre-pandemic level of 2019. Output and employment in fishing are expected to keep declining, albeit at a slower pace than the previous decade due to a positive outlook in the short-term. This industry will continue to face supply constraints resulting from various quotas imposed on different fish species.
Output growth in forestry is projected to return to positive territory, although it will remain relatively weak, constrained by the slowdown anticipated in residential investment across North America, lower demand for paper products, and limited supply of merchantable timber. Employment growth is expected to accelerate marginally from the previous decade, partly reflecting further declines in productivity.
Figure 7 presents the decomposition of real GDP growth into employment and productivity growth for the primary industries over the projection period. It shows that productivity is expected to account for the totality of GDP growth in oil/gas extraction and most of GDP growth in agriculture. Inversely, employment is expected to account for the totality of GDP growth in mining and forestry and most of GDP growth in support activities.
Figure 7: Decomposition of Real GDP Growth: Primary Industries, Projection 2022-2031
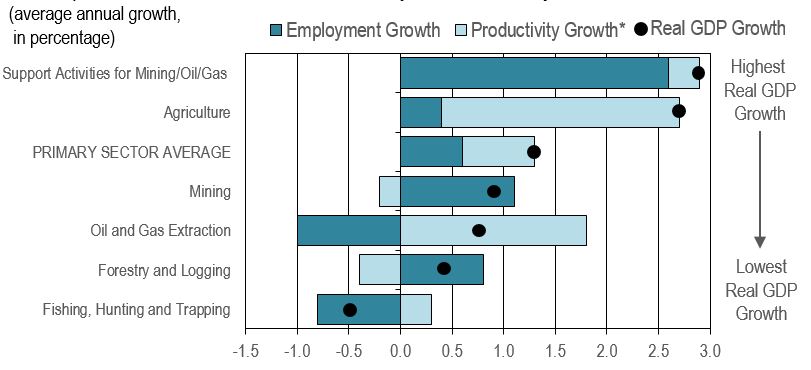
Source: ESDC 2022 COPS industrial outlook.
* Note: The term productivity refers to labour productivity.
Text version of Figure 7: Decomposition of Real GDP Growth: Primary Industries, Projection 2022-2031
In oil and gas extraction, productivity growth is expected to be the sole contributor to GDP growth over the period 2022-2031, as employment is projected to contract significantly. This situation primarily reflects the fact that the exploitation of oil sands has become less labour intensive. Technological innovations have boosted productivity in this industry due to major developments in hydraulic fracturing and horizontal directional drilling techniques; GPS surveying; three-dimensional data maps; airborne technologies; remote-operated equipment; automated loading and transportation systems; advanced robotics; and seismic mapping and imaging.
In agriculture, productivity growth is expected to account for about 85% of GDP growth on average over the projection period (versus 15% for employment growth), reflecting further consolidation, mechanization and computerization of operations. Technological innovations include the use of drones to monitor crops and land area; driverless tractors guided by geo-positioning satellite devices; automated systems for pest management; data-intensive applications for optimal seeding and fertilization; self-learning milking machines; and biometric sensors to examine animals.
In support activities for mining and oil and gas extraction, it is rather employment growth that is expected to account for most of GDP growth (92% on average over the projection period versus only 8% for productivity growth). This situation remains similar to the trend observed in the past decade: while the level of productivity is relatively high, it has remained essentially flat over time. This absence of productivity growth reflects the fact that most of the jobs in the industry are characterized by occupational tasks that remain hardly automatable given current technologies.
In mining and forestry, productivity growth is projected to be negative, leaving employment growth as the sole contributor to GDP growth. However, this situation strictly reflects a sharp decline in productivity in 2022 due to significant gains anticipated in employment. Productivity growth is expected to resume in both industries in the remaining years of the projection period, stimulated by the growing adoption of more efficient technologies and the development of new and high value added wood-based products, such as biofuels, biochemicals and biopolymers.
It is also worth mentioning that, despite the negative pace of growth projected in GDP for the fishing industry, productivity growth is expected to remain positive, partly offsetting the decline anticipated in employment. Additional gains in productivity reflect continuous improvements in various technologies, including advanced vessels and gear designs, hydraulic lifting equipment, and better fish detection equipment using computer-aided methods.
Table 3 presents the projected change in employment for the primary industries between 2022 and 2031. It shows that the support activities for mining, oil and gas extraction are projected to experience the largest employment gains in the primary sector, followed by the agriculture and mining industries.
| Rank | Industry | Employment in 2021 |
Employment in 2031 |
Average Annual Growth |
Cumulative Change |
|---|---|---|---|---|---|
| 1 | Support Activities for Mining/Oil/Gas | 76.6 | 99.3 | +2.6% | +22.7 |
| 2 | Agriculture | 252.1 | 262.4 | +0.4% | +10.3 |
| 3 | Mining | 78.9 | 87.9 | +1.1% | +9.0 |
| 4 | Forestry and Logging | 50.6 | 55.0 | +0.8% | +4.4 |
| 5 | Fishing, Hunting and Trapping | 16.8 | 15.5 | -0.8% | -1.3 |
| 6 | Oil and Gas Extraction | 101.5 | 91.5 | -1.0% | -10.0 |
| TOTAL - PRIMARY SECTOR | 576.5 | 611.6 | +0.6% | +35.1 |
Sources: Statistics Canada (historical) and ESDC 2022 COPS industrial outlook.
In the primary sector, employment gains in support activities for mining, oil and gas extraction; agriculture; mining; and forestry are projected to be partly offset by employment losses in oil and gas extraction and fishing, resulting in a net increase of 35,000 in total employment between 2021 and 2031.
Industries expected to show the largest gains in employment (in terms of number) are not necessarily those expected to show the strongest growth rates in employment (in terms of percentage). This is because the size of employment differs significantly across the industrial breakdown, with industries having a much larger number of workers than others.
Support activities for mining, oil and gas extraction are projected to experience the largest gains in employment, up by 22,700, followed distantly by agriculture (+10,300), mining (+9,000) and forestry (+4,400).
Oil and gas extraction is projected to experience the largest decline in employment, down by 10,000, followed by fishing (-1,300).
Total employment in the primary sector is expected to reach 611,600 in 2031, remaining significantly below its historical peak of 679,900 recorded in 2013, mostly as a result of large employment deficits in agriculture (-50,000) and support activities for mining, oil and gas extraction (-27,000)./p>
The primary sector is also the only sector where employment is expected to remain below its pre-pandemic level of 625,100 over the projection period, reflecting an employment deficit of 29,500 in agriculture in 2031 relative to 2019. Employment in agriculture fell sharply in 2020 and 2021 and is not projected to fully recover over the forecast horizon.
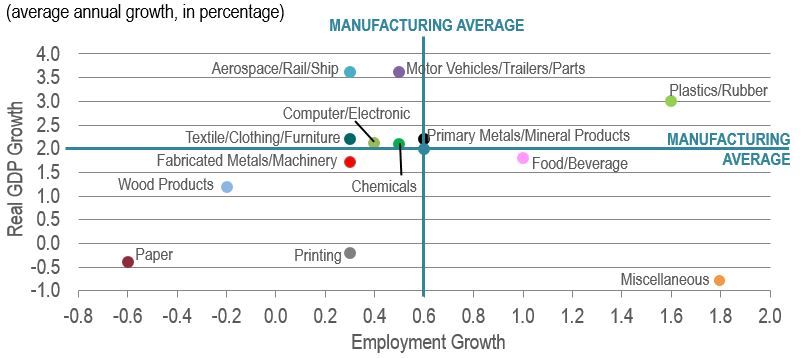
Figure 8 presents real GDP and employment growth among the manufacturing industries over the projection period. It shows that manufacturing, motor vehicles, trailers and parts and non-automotive transportation equipment are projected to post the strongest growth in output, while plastics and rubber and miscellaneous products are projected to post the strongest growth in employment over the period 2022-2031.
Figure 8: Real GDP and Employment Growth: Manufacturing Industries, Projection 2022-2031
Source: ESDC 2022 COPS industrial outlook.
Text version of Figure 8: Real GDP and Employment Growth: Manufacturing Industries, Projection 2022-2031
Most of Canada’s manufacturing industries rely on exports and are exposed to international competition. Consequently, global and U.S. economic conditions, exchange rates, trade agreements, import penetration and globalisation strongly influence the performance of those industries.
Motor vehicles, trailers and parts and aerospace, rail, ship and other non-automotive transportation equipment are projected to experience the strongest growth in real GDP within the manufacturing sector over the period 2022-2031, as output and exports gradually recover from the sharp declines recorded during the pandemic. Growth is expected to be supported by a booming electric vehicle sector and global demand for travel and public transit systems, including rail. Employment growth in these two industries is projected to be moderate as most of the growth in output is expected to come from strong increases in productivity.
Miscellaneous manufacturing (medical equipment, jewellery, sporting goods, toys, office supplies) is expected to post the strongest growth in employment. This primarily reflects lower productivity as real GDP is projected to contract after peaking in 2021, with most of the decline occurring in the near term, due to the unwinding of strong pandemic-related demand for medical equipment and supplies. Nevertheless, the industry is expected to record solid gains in employment, particularly in 2022, due to the growing demand for skilled labour used in the design and production of a wide range of high value added products.
Plastics and rubber products are also projected to experience solid growth in employment as a result of robust growth in output. This industry is expected to benefit from the strong acceleration anticipated in manufacturing activity as demand for plastics and rubber products is heavily tied to the North American manufacturing supply chain. Rising demand for electric vehicles is also expected to increase demand for light-weight plastic materials, in an effort to reduce vehicle weight and increase power efficiency. Employment growth is also projected to be above the manufacturing average in food and beverage products as labour is expected to account for a large part of the growth in output.
Paper manufacturing and printing activities are projected to post small declines in output, as the increasing use of electronic media and telework will continue to lower demand for paper and printed materials. Additional job losses are expected in the paper industry, while employment growth is expected to be relatively weak in the printing industry. Output growth in wood products is expected to be constrained by the gradual slowdown anticipated in residential investment in North America. Further gains in productivity are projected to keep lowering employment in this industry, but at a slower pace than the previous ten years.
The pace of growth in real GDP and employment is projected to be around or slightly below the manufacturing average in all other industries within the sector.
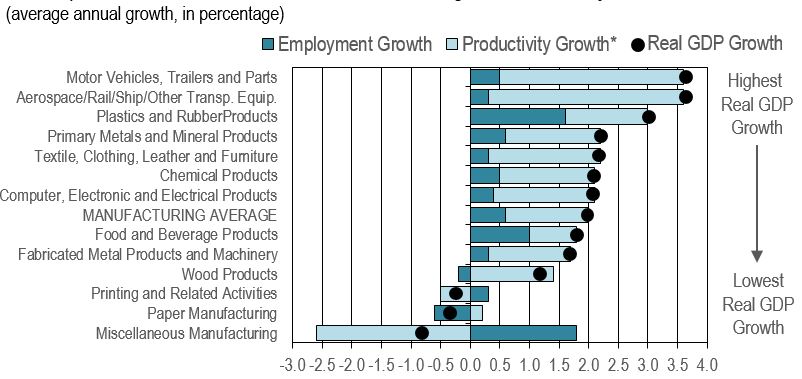
Figure 9 presents the decomposition of real GDP growth into employment and productivity growth for the manufacturing industries over the projection period. It shows that productivity growth is expected to account for the largest part of GDP growth in most manufacturing industries, restraining job creation significantly in the sector.
Figure 9: Decomposition of Real GDP Growth: Manufacturing Industries, Projection 2022-2031
Source: ESDC 2022 COPS industrial outlook.
* Note: The term productivity refers to labour productivity.
Text version of Figure 9: Decomposition of Real GDP Growth: Manufacturing Industries, Projection 2022-2031
Productivity growth is projected to be the largest contributor of GDP growth in most manufacturing industries over the period 2022-2031. This reflects the fact that employment in those industries is largely composed of routine tasks that can be increasingly automated with new applications enabled by technological progress. The solid pace of growth anticipated in investment related to machinery and equipment (M&E) is expected to increase the amount of capital and technology available per worker, boosting productivity.
Some of the most innovative technologies that are expected to continue to transform manufacturing operations and improve productivity over the projection period are:
- Advanced robotics: the introduction of sophisticated sensors and highly adaptable functional robotic equipment in order to improve human and machine interaction to make complex parts of the assembly process faster, easier and safer.
- Augmented reality: the introduction of text, graphic, audio and other virtual instructions superimposed onto goggles, allowing operators to perform complex tasks step-by-step and improve the accuracy and timing of these tasks, while being notified of quality risks or shortcomings of present-day devices on the assembly line.
- 3D printing: the production of solid objects from digital designs in a precisely determined shape using multiple layers of plastic, resin or other materials in order to develop prototypes, reduce the design-to-production cycle and lower operation costs.
- Internet of Things (IoT): the power of the Internet to link machines, sensors, computers and humans and develop new ways of collecting, processing and analyzing information to deliver higher-quality, more durable and reliable products
There are only two manufacturing industries where productivity is expected to decline over the projection period: printing and miscellaneous products. This reflects a large drop in productivity in the short-term as result of lower GDP and higher employment. In the medium-to long-term, once the adjustments to a post-pandemic environment will be completed, productivity growth is expected to resume, with output growth exceeding employment growth. However, gains in productivity will not be strong enough to offset the steep declines expected in the short-term, resulting in negative productivity growth for the entire projection period.
Table 4 presents the projected change in employment for the manufacturing industries between 2021 and 2031. It shows that food/beverage products, miscellaneous manufacturing and plastics/rubber products are expected to account for 66% of the net increase in manufacturing employment.
| Rank | Industry | Employment in 2021 |
Employment in 2031 |
Average Annual Growth |
Cumulative Change |
|---|---|---|---|---|---|
| 1 | Food and Beverage Products | 311.5 | 342.6 | +1.0% | +31.1 |
| 2 | Miscellaneous Manufacturing | 113.5 | 135.5 | +1.8% | +21.6 |
| 3 | Plastics and Rubber Products | 94.1 | 110.8 | +1.6% | +15.9 |
| 4 | Fabricated Metal Products and Machinery | 271.8 | 281.4 | +0.3% | +9.6 |
| 5 | Motor Vehicles, Trailers and Parts | 168.2 | 176.4 | +0.5% | +8.2 |
| 6 | Primary Metals and Mineral Products | 126.6 | 134.0 | +0.6% | +7.4 |
| 7 | Chemical Products | 115.4 | 121.6 | +0.5% | +6.2 |
| 8 | Computer, Electronic and Electrical Products | 106.7 | 111.3 | +0.4% | +4.6 |
| 9 | Textiles, Clothing, Leather and Furniture | 117.3 | 120.2 | 0.3% | +2.9 |
| 10 | Aerospace, Rail, Ship and Other Transp. Equip. | 81.9 | 84.3 | +0.3% | +2.4 |
| 11 | Printing and Related Activities | 51.1 | 52.6 | +0.3% | +1.5 |
| 12 | Wood Product Manufacturing | 109.1 | 106.5 | -0.2% | -2.6 |
| 13 | Paper Manufacturing | 67.8 | 63.7 | -0.6% | -4.1 |
| TOTAL - MANUFACTURING SECTOR | 1,735.5 | 1,840.0 | +0.6% | +104.5 |
Sources: Statistics Canada (historical data) and ESDC 2022 COPS industrial outlook.
Among the thirteen manufacturing industries, employment is projected to expand in eleven industries and to contract in two industries, resulting in a net increase of 104,500 in total manufacturing employment between 2021 and 2031.
Industries expected to show the largest gains in employment (in terms of number) are not necessarily those expected to show the strongest growth rates in employment (in terms of percentage). This is because the size of employment differs significantly across the industrial breakdown, with industries having a much larger number of workers than others.
As a result, the largest gains in employment are projected to be in food and beverage products (+31,100), followed by miscellaneous manufacturing (+21,600) and plastic and rubber products (+15,900). These three industries are expected to account for 66% of net job creation in the manufacturing sector. In other industries projected to experience positive growth in employment, gains are ranging from 1,500 to 9,600.
Employment is expected to keep declining in paper and wood products, albeit at a slower pace than the previous ten years, down by 4,100 and 2,600 respectively, with most of the declines occurring in the short-term.
Total employment in the manufacturing sector is projected to reach about 1.8 million in 2031, remaining well below its historical peak of 2.3 million recorded in 2004, with the largest employment deficits in textiles, clothing, leather and furniture (-128K), wood products (-93K), motor vehicles, trailers and parts (-63K), and printing activities (-61K). In contrast, employment is expected to be higher in a few industries relative to 2004, including food and beverage products (+32K) and miscellaneous manufacturing (+32K).
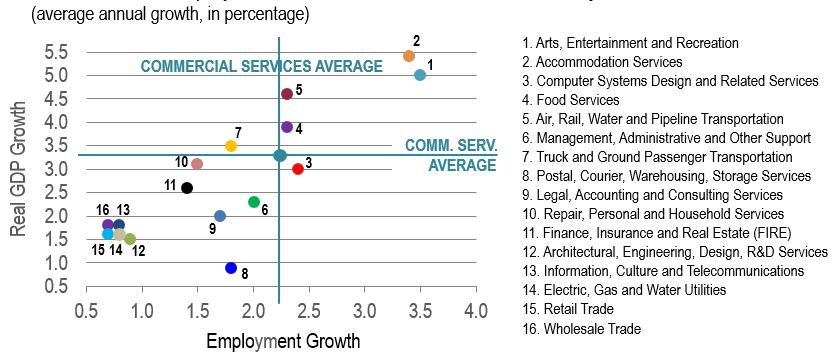
Figure 10 presents real GDP and employment growth among the commercial services industries over the projection period. It shows that industries supplying hard-to-distance commercial services and travel or tourism activities are projected to post robust growth in real GDP and employment over the period 2022-2031, as they gradually recover from the sharp declines recorded during the pandemic.
Figure 10: Real GDP and Employment Growth: Commercial Services Industries, Projection 2022-2031
Source: ESDC 2022 COPS industrial outlook.
Text version of Figure 10: Real GDP and Employment Growth: Commercial Services Industries, Projection 2022-2031
Most of Canada’s commercial services industries rely on the domestic market, with consumer spending and business activity as the main drivers of demand for such services. The chart clearly shows a positive correlation between real GDP growth and employment growth for most industries.
Industries projected to experience the strongest growth rates in real GDP and employment over the period 2022-2031 are mainly those that were severely impacted by the public health measures put in place during the pandemic and where a significant amount of pent-up demand has been cumulated. Those industries generally supply hard-to-distance services and are often stimulated by tourism activities and business travel. Such services include: arts, entertainment and recreation (concerts, theaters, museums, casinos, sport events, gyms); accommodation and food services; and air, rail and water transportation.
Truck and ground passenger transportation; repair, personal and household services; and management, administrative and other support services were also negatively impacted by lockdowns and other related pandemic disruptions. As they progressively recover, these three industries are projected to benefit from a relatively strong outlook, positioning themselves in the first half of the commercial services industries in terms of output and/or employment growth.
Most other industries are projected to experience growth in both output and employment largely below the commercial services average. Those industries were less severely impacted by public health restrictions and some of them even recorded solid growth during the pandemic. For example, finance, insurance and real estate benefited from a booming housing market with real GDP and employment reaching hitorical highs in 2021. Similar trends were observed in postal and warehousing services and information, culture and telecommunications services due to a more intensive use of e-commerce, telework and audio/video streaming services in response to home confinement. Output and employment growth in such industries is expected to ease gradually in a post-pandemic environment. Wholesale and retail trade also benefited from a shift in consumption patterns towards goods during the pandemic. However, an aging population is expected to consume more services and slightly fewer goods, limiting output an employment growth in these two industries over the projection period.
After recording the strongest growth rates across the Canadian economy over the past decade, real GDP and employment in computer systems design and related services are projected to keep growing at a decent but slower pace, driven by rapid technological innovations and the need for firms across a wide range of sectors to constantly upgrade their IT infrastructure to remain competitive. Cyber security, cloud-based platforms, big data, internet of things (IoT), 5G network, machine learning, artificial intelligence, fintech/insurtech and blockchains represent a multitude of growth opportunities for this industry.
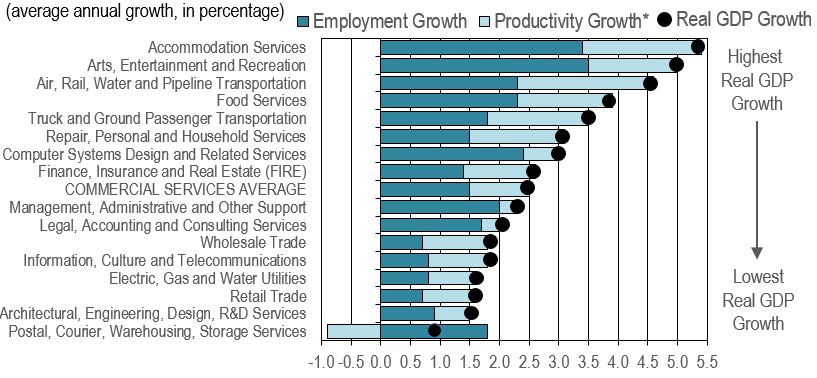
Figure 11 presents the decomposition of real GDP growth into employment and productivity growth for the commercial services industries over the projection period. It shows that Productivity growth is expected to account for a significant part of GDP growth in many commercial services industries as a result of notable improvements in digital and cognitive technologies. This will help contain demographic pressures on labour supply.
Figure 11: Decomposition of Real GDP Growth: Commercial Services Industries, Projection 2022-2031
Source: ESDC 2022 COPS industrial outlook.
* Note: The term productivity refers to labour productivity.
Text version of Figure 11: Decomposition of Real GDP Growth: Commercial Services Industries, Projection 2022-2031 (average annual growth, in percentage)
Productivity growth is projected to be an important contributor of GDP growth in many commercial services industries over the period 2022-2031. Because those industries are the largest employers of the Canadian economy, the gradual slowdown anticipated in labour force growth will encourage businesses to strengthen productivity and eventually replace labour with capital in response to a tighter labour market.
Rapid advances in digital and cognitive technologies are expected to support productivity and alleviate some of the labour market pressures resulting from demographic factors. Major developments in online and mobile applications, smart systems, autonomous transportation, machine learning and artificial intelligence are expected to increase the number of tasks that could potentially be performed or complemented by technology across a wide range of services occupations, including human-centric jobs or those requesting a higher level of education.
For example, e-commerce, e-banking, and online insurance and housing services have improved productivity and restrained labour demand in retail trade and finance, insurance and real estate over the past decade. This trend is expected to amplify over the projection period with new applications arisen from advanced technologies, such as inventory software, warehouse robotics, self-serve kiosks, automated online customer support (chatbots), smart price tags (that can be changed in real time), indoor positioning and detection systems, fintech, insurtech, blockchain transactions, artificial and virtual agents, etc.
In food services, applications such as self-services ordering kiosks and the ability for customers to place orders and pay via mobile devices have automated operations traditionally involving several steps and personal interaction with clients and among workers. Online hotel and travel bookings, digital platforms such as Airbnb and Uber and streaming platforms such as Netflix and Spotify have also transformed the ways services are provided in the accommodation, transportation and cultural industries.
A number of commercial services industries remain, however, less subject to technological disruptions Management activities; legal and consulting services; computer systems design; and arts, entertainment and recreation services are characterized by a large number of human-centric occupations involving tasks and skills that are less likely to be performed or complemented by technology. Managers, lawyers, software engineers, artists and professional athletes are relevant examples of such occupations.
In postal, courier, warehousing and storage services, productivity growth is projected to be negative, leaving employment growth as the sole contributor to GDP growth. However, this situation primarily reflects a sharp decline in productivity in 2022 due to lower output and higher employment. Productivity is expected to remain essentially unchanged for the remaining years of the projection period (flat growth).
Table 5 presents the projected change in employment for the commercial services industries between 2021 and 2031. It shows that food services are expected to create the largest number of jobs in commercial services, followed by computer systems design and finance, insurance and real estate.
| Rank | Industry | Employment in 2021 |
Employment in 2031 |
Average Annual Growth |
Cumulative Change |
|---|---|---|---|---|---|
| 1 | Food Services | 825.9 | 1,033.9 | +2.3% | +208.0 |
| 2 | Finance, Insurance and Real Estate (FIRE) | 1,299.9 | 1,495.6 | +1.4% | +195.7 |
| 3 | Retail Trade | 2,185.1 | 2,352.1 | +0.7% | +167.0 |
| 4 | Management, Administrative and Other Support | 707.3 | 861.8 | +2.0% | +154.5 |
| 5 | Computer Systems Design and Related Services | 530.9 | 674.1 | +2.4% | +143.2 |
| 6 | Arts, Entertainment and Recreation | 327.3 | 462.0 | +3.5% | +134.7 |
| 7 | Legal, Accounting and Consulting Services | 718.2 | 847.5 | +1.7% | +129.3 |
| 8 | Repair, Personal and Household Services | 734.0 | 854.8 | +1.5% | +120.8 |
| 9 | Truck and Ground Passenger Transportation | 500.5 | 601.0 | +1.8% | +100.5 |
| 10 | Air, Rail, Water and Pipeline Transportation | 244.3 | 305.5 | +2.3% | +61.2 |
| 11 | Accommodation Services | 129.8 | 180.5 | +3.4% | +50.7 |
| 12 | Postal, Courier, Warehousing, Storage Services | 245.2 | 293.7 | +1.8% | +48.5 |
| 13 | Wholesale Trade | 633.2 | 678.2 | +0.7% | +45.0 |
| 14 | Architectural, Engineering, Design, R&D Services | 424.7 | 466.6 | +0.9% | +41.9 |
| 15 | Information, Culture and Telecommunications | 393.3 | 426.3 | +0.8% | +33.0 |
| 16 | Electric, Gas and Water Utilities | 140.9 | 152.3 | +0.8% | +11.4 |
| TOTAL - COMMERCIAL SERVICES | 10,040.5 | 11,685.9 | +1.5% | +1,654.4 |
Sources: Statistics Canada (historical data) and ESDC 2022 COPS industrial outlook.
Employment is projected to expand in all sixteen commercial services industries between 2021 and 2031, resulting in an overall increase of about 1.6 million in total employment for this group of industries.
Industries expected to show the largest gains in employment (in terms of number) are not necessarily those expected to show the strongest growth rates in employment (in terms of percentage). This is because the size of employment differs significantly across the industrial breakdown, with industries having a much larger number of workers than others.
As a result, food services are projected to experience the largest gains in employment (+208,000), followed by finance, insurance and real estate (+195,700) and retail trade (+167,000). Those three industries alone are projected to account for more than one third (35%) of the total increase in employment within commercial services by 2031.
It is worth noting that the very large retail trade industry is expected to create more jobs than the arts, entertainment and recreation services industry despite a much lower pace of growth in employment (average annual rate of 0.7% versus 3.5%).
The number of workers in commercial services is projected to reach a new historical peak of about 11.7 million in 2031, accounting for 54% of total employment across the Canadian economy, slightly up from 53% in 2021.
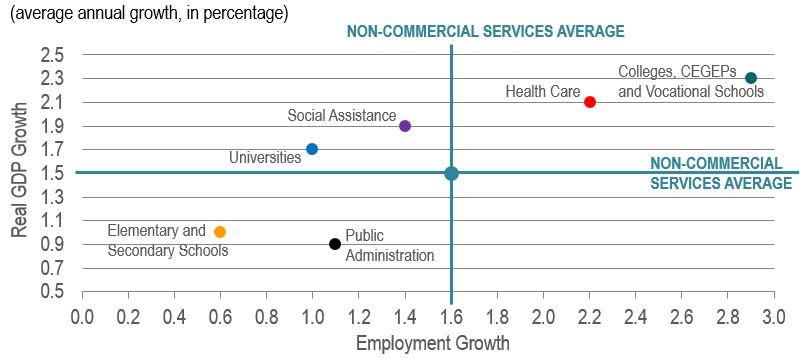
Figure 12 presents real GDP and employment growth among the non-commercial services industries over the projection period. It shows that Colleges, CEGEPs and vocational schools are projected to experience the strongest growth rates in real GDP and employment within non-commercial services over the period 2022-2031, followed by health care and social assistance.
Figure 12: Real GDP and Employment Growth: Non-Commercial Services Industries, Projection 2022-2031
Source: ESDC 2022 COPS industrial outlook.
Text version of Figure 12: Real GDP and Employment Growth: Non-Commercial Services Industries, Projection 2022-2031
Canada’s non-commercial services industries largely consist of government and para-public services. Such services strongly rely on public finance and demographic factors. Again, the chart shows a positive correlation between real GDP growth and employment growth for most industries.
After contracting significantly in 2020, during the first year of the pandemic, real GDP and employment in colleges, CEGEPs and vocational schools partly recovered in 2021 and are projected to experience the strongest growth rates among non-commercial services over the period 2022-2031. Growth is expected to be driven by the return of foreign students to Canada in the near term and by the favourable impacts of domestic demographic factors on enrollment rates over the longer term.
Health care is also projected to post strong growth in output and employment, as Canada continues to recover from the backlog in “non-essential” health care treatments caused by the pandemic and as the population continues to age. The federal pledge for universal dental care is an additional factor expected to increase demand and support output and employment growth in the industry.
In social assistance, relatively robust growth projected in real GDP and employment primarily reflects increased demand for child day care services, driven by the implementation of the Canada-wide early learning and child care system which aims to reduce the average fee to 10$ a day for children under the age of five in all provinces and territories by 2026 (except in Quebec where a similar system already exists).
While universities are expected to benefit from increased provincial spending on tertiary education and growth in foreign student enrolment over the next ten years, domestic demographic factors will weigh on overall enrolment. Population aged 18 to 24 has been stagnant since 2013 and is projected to remain below required levels to sustain strong output growth in universities, limiting job creation at the same time.
The outlook for public administration is projected to be relatively weak, as federal and provincial governments contend with large budget deficits resulting from the pandemic. After surging in 2021, real GDP is projected to contract in 2022 and 2023 and increase at a subdued pace thereafter, lowering the average pace of growth in output and employment within the industry for the entire projection period.
Output and employment growth in elementary and secondary schools is also projected to be largely below the non-commercial services average, primarily reflecting the impact of historically low fertility rates on population aged 5 to 11. However, significant increases in teenage population over the coming years and higher immigration targets are expected to help support enrollment in elementary and secondary schools.
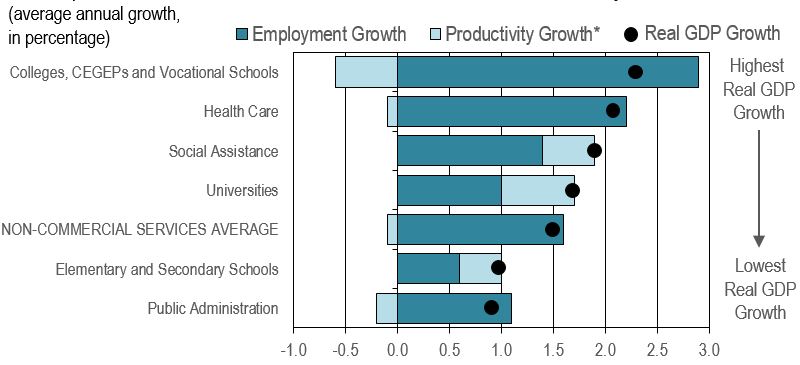
Figure 13 presents the decomposition of real GDP growth into employment and productivity growth for the non-commercial services industries over the projection period. It shows that employment growth is expected to account for the totality or a large part of GDP growth in all non-commercial services, as such activities are generally more labour intensive than most of the goods-producing and commercial services industries.
Figure 13: Decomposition of Real GDP Growth: Non-Commercial Services Industries, Projection 2022-2031
Source: ESDC 2022 COPS industrial outlook.
* Note: The term productivity refers to labour productivity.
Text version of Figure 13: Decomposition of Real GDP Growth: Non-Commercial Services Industries, Projection 2022-2031
Employment growth is projected to be the sole or the main contributor of GDP growth in all non-commercial services industries over the period 2022-2031, as such activities are generally more labour intensive than most of the goods-producing and commercial services industries.
That said, the negative pace of growth projected in productivity for a number of industries is somewhat misleading as it reflects adjustments to pandemic-related disruptions in GDP and employment over the short-term. Indeed, employment growth in colleges, CEGEPs and vocational schools and health care is expected to exceed GDP growth in the near term, while the decline projected in GDP for public administration in 2022-2023 is expected to be accompanied by small employment gains, resulting in significant declines in productivity within these three industries during the first years of the projection. Productivity growth is expected to resume for most of the period 2024-2031, but remain weak in health care.
The measurement of output and productivity in non-commercial services also differs from the other sectors of the economy where goods and services are traded and more easily valued in monetary terms. Consequently, the term “productivity” in the government and para-public sectors is often associated with improved efficiency and effectiveness of an activity. The gradual slowdown anticipated in labour force growth, combined with fiscal constraints, will force governments and para-public institutions to improve effectiveness and implement new labour-saving ways of delivering services, particularly in health care where labour shortages are expected to persist.
New models of services delivery include the expansion of the private sector involvement in the provision of health care services, the growing use of home care, and the consideration of permitting nurses and pharmacists to perform services that used to be provided by doctors. Technology is also playing an important role in almost all processes, including patient registration, data monitoring, lab tests and self-care tools. Smartphones and tablets are starting to replace conventional monitoring and recording systems, and people are now given the option of undergoing a full consultation in the privacy of their homes. Services are being taken out of hospital walls and integrated with user-friendly accessible devices.
In educational services, productivity (or efficiency) can be influenced by factors such as the ratio of students per teacher, the availability of online courses and e-learning applications for post-secondary education, or the use of educational tablets, virtual labs, electronic textbooks and online resources in elementary and secondary schools. In public administration, fiscal challenges are the main factors expected to lead to the creation of more efficient models to improve government program management and public services delivery.
Table 6 presents the projected change in employment for the non-commercial services industries between 2021 and 2031. It shows that health care alone is projected to account for 57% of the employment gains in non-commercial services, followed distantly by public administration and colleges, CEGEPs and vocational schools.
| Rank | Industry | Employment in 2021 |
Employment in 2031 |
Average Annual Growth |
Cumulative Change |
|---|---|---|---|---|---|
| 1 | Health Care | 2,044.3 | 2,537.4 | +2.2% | +493.1 |
| 2 | Public Administration | 1,066.3 | 1,184.6 | +1.1% | +118.3 |
| 3 | Colleges, CEGEPs and Vocational Schools | 280.3 | 374.0 | +2.9% | +93.7 |
| 4 | Social Assistance | 514.2 | 589.2 | +1.4% | +75.0 |
| 5 | Elementary and Secondary Schools | 877.0 | 930.8 | +0.6% | +53.8 |
| 6 | Universities | 295.2 | 327.3 | +1.0% | +32.1 |
| TOTAL - NON-COMMERCIAL SERVICES | 5,077.4 | 5,943.4 | +1.6% | +866.0 |
Sources: Statistics Canada (historical data) and ESDC 2022 COPS industrial outlook.
Employment is projected to expand in all six non-commercial services industries between 2021 and 2031, resulting in an overall increase of 866,000 in total employment for this group of industries.
Industries expected to show the largest gains in employment (in terms of number) are not necessarily those expected to show the strongest growth rates in employment (in terms of percentage). This is because the size of employment differs significantly across the industrial breakdown, with industries having a much larger number of workers than others.
As a result, health care is projected to experience the largest gains in employment (+493,100), followed distantly by public administration (+118,300) and colleges, CEGEPS and vocational schools (+93,700). Health care alone is projected to account for 57% of the total increase in employment within non-commercial services by 2031.
The number of workers in non-commercial services is projected to reach a new historical peak of about 5.9 million in 2031, accounting for 27% of total employment across the Canadian economy, a similar proportion than in 2021.
Comparisons of Employment Projections across Industries
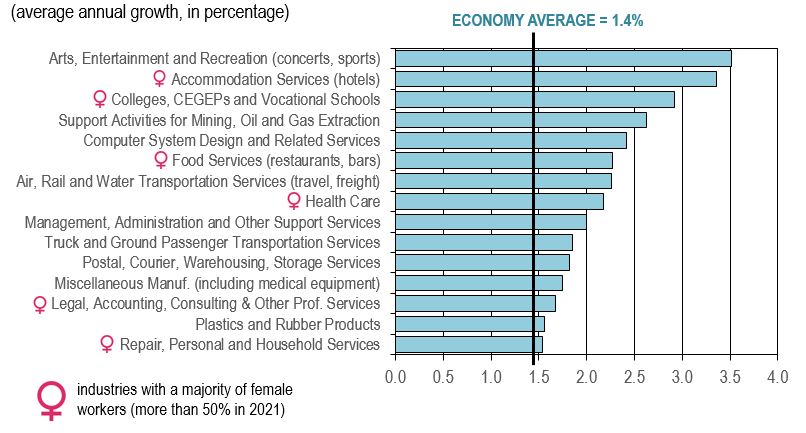
Figure 14 presents the industries that are projected to post the strongest growth in employment over the period 2022-2031.
Figure 14: Industries Projected to Post the Strongest Growth in Employment, 2022-2031
Source: ESDC 2022 COPS industrial outlook.
Text version of Figure 14: Industries Projected to Post the Strongest Growth in Employment, 2022-2031
Industries projected to experience the strongest growth in employment (i.e. above 1.5% annually) are also those projected to experience among the strongest growth in output or those that are characterized by a high degree of labour intensity and human-centric jobs (low productivity growth). Below are some of the key factors expected to support output and job creation in those industries:
- The accumulation of a large amount of pent-up demand for hard-to-distance services during the pandemic: arts, entertainment and recreation (concerts, theaters, museums, casinos, sport events, gyms); hotels, restaurants and bars; travel and tourism; personal and household services.
- The return of foreign students to Canada and the positive impacts of domestic demographics on enrollment rates in colleges, CEGEPs and vocational schools.
- Renewed growth in support activities for mining/oil/gas (such as drilling and exploration) in response to higher oil prices (short-term) and to the federal government’s critical mineral strategy (long-term).
- Rapid innovations in information and communication technologies (ICT) and the need for businesses to continuously upgrade their ICT infrastructure to remain secure and competitive (computer systems).
- Strong demand for health care, stimulated by population aging, the recovery from the backlog in “non-essential” treatments caused by the pandemic, and the universal dental care program.
- The growing number of firms across the economy that choose to outsource administrative and support functions in order to remain focused on their core activities and increase operation efficiency.
- The faster pace of growth anticipated in manufacturing shipments (truck transportation) and additional investment in public and urban transit systems (ground passenger transportation).
- Continued growth in e-commerce and the associated demand for postal, courier, warehousing and storage services (although a large part of the unfulfilled demand took place during the pandemic).
- Increased demand for skilled workers in the design and production of medical equipment and the positive impact of the acceleration projected in manufacturing activity on plastics and rubber products.
- Growing demand for professional advice on planning, logistics, mergers, acquisitions, environmental regulation and implementation of new technologies (legal, accounting and consulting services).
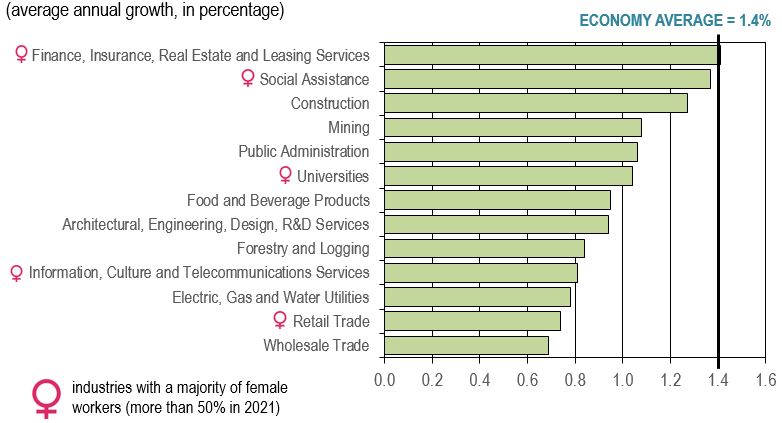
Figure 15 presents the industries that are projected to post moderate growth in employment over the period 2022-2031.
Figure 15: Industries Projected to Post Moderate Growth in Employment, 2022-2031
Source: ESDC 2022 COPS industrial outlook.
Text version of Figure 15: Industries Projected to Post Moderate Growth in Employment, 2022-2031
Industries projected to experience moderate growth in employment (i.e. between 0.7% and 1.4% annually) are also among those projected to experience moderate growth in output and/or those where productivity growth is expected to account for a significant part of real GDP growth.
This group includes several industries that performed relatively well in terms of output and employment growth during the pandemic, such as finance, insurance and real estate; construction; public administration; information, culture and telecommunications services; retail trade; and wholesale trade. Such industries benefited from a booming housing market; the development and implementation by public servants of various government pandemic-related support programs; a more intensive use of telework and streaming services by businesses and households; and a shift in consumption patterns toward goods and online shopping.
However, those industries are projected to grow at a more moderate pace, on average, over the next decade. Indeed, lower purchasing power resulting from high inflation along with rising interest and mortgage rates and large government deficits are some of the key factors expected to affect growth in consumer spending (notably for goods), residential investment and government expenditures, particularly in the short- to medium-term.
For most industries listed on the chart, moderate output growth is expected to limit employment growth. Relevant examples are forestry, public administration, mining and construction which are projected to experience the weakest growth rates in output among the group.
In many other industries, productivity growth is expected to account for a significant share of the modest pace of growth anticipated in output, restraining employment growth further, particularly in industries providing commercial services (such as wholesale and retail trade; information, culture and telecommunication services; and finance, insurance and real estate) or non-commercial services (e.g. universities and social assistance). This situation reflects increased automation and rapid advances in digital and cognitive technologies. It also reflects new ways of delivering services and replace labour by capital wherever possible in response to demographic pressures on labour supply in Canada.
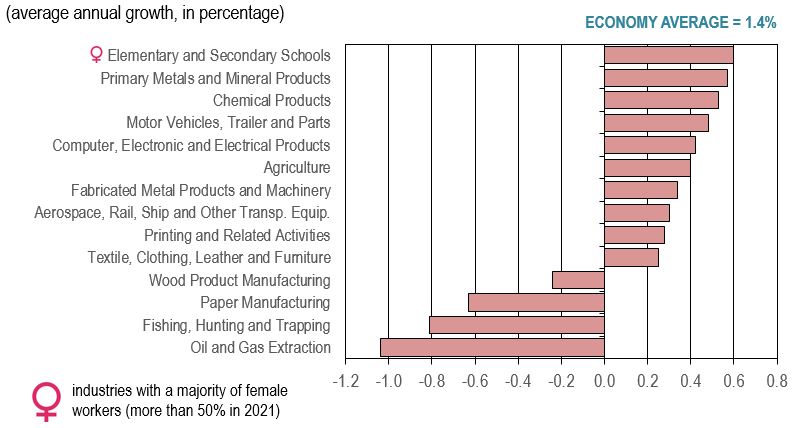
Figure 16 presents the industries that are projected to post the weakest growth or declines in employment over the period 2022-2031.
Figure 16: Industries Projected to Post the Weakest Growth or Declines in Employment, 2022-2031
Source: ESDC 2022 COPS industrial outlook.
Text version of Figure 16: Industries Projected to Post the Weakest Growth or Declines in Employment, 2022-2031
Industries projected to experience the weakest growth or declines in employment (i.e. below 0.6% annually) are also those projected to experience among the weakest growth in output and/or those where productivity growth is expected to account for a large part (or the totality) of real GDP growth.
This group is essentially composed of manufacturing and primary industries, with the exception of elementary and secondary schools. Many of those industries have experienced a stagnation or a declining trend in output and/or employment over the past several years, such as agriculture, printing, textiles, clothing, furniture, wood products, paper and fishing. This group of industries is expected to face similar challenges than those experienced in the past as well as new challenges, including:
- The intensification of foreign competition from low cost-producers in the manufacturing sector;
- Lower demand for paper and printing due to the growing use of electronic media and telework;
- Limited demand for wood, bricks, windows, furniture, appliances and other manufactured products due to the gradual slowdown projected in residential investment in North America;
- Timber and fish supply constraints (allowable annual cuts and various quotas on fish species);
- Difficulties to attract workers in agriculture and out-migration from rural/fishing communities;
- Environmental regulation and limited production and pipeline capacity in oil and gas extraction.
Productivity growth is expected to account for a large share (or the totality) of output growth in most industries listed on the chart, restraining employment growth (or resulting in employment declines) over the projection period. This reflects the fact that employment in those industries is largely composed of routine tasks that can be increasingly automated with new applications enabled by technological progress. The solid pace of growth anticipated in investment related to machinery and equipment (M&E) is expected to increase the amount of capital and technology available per worker, boosting productivity. For example, advanced robotics, augmented reality, 3D printing and internet of things (IoT) are among the most innovative technologies that are expected to transform manufacturing operations and improve productivity over the forecast horizon. Significant job losses in oil and gas extraction reflects the fact that the exploitation of oil sands has become less labour intensive due to advancements in extractive technologies and modular facility design. Additional job losses in fishing and paper primarily reflects further declines in output
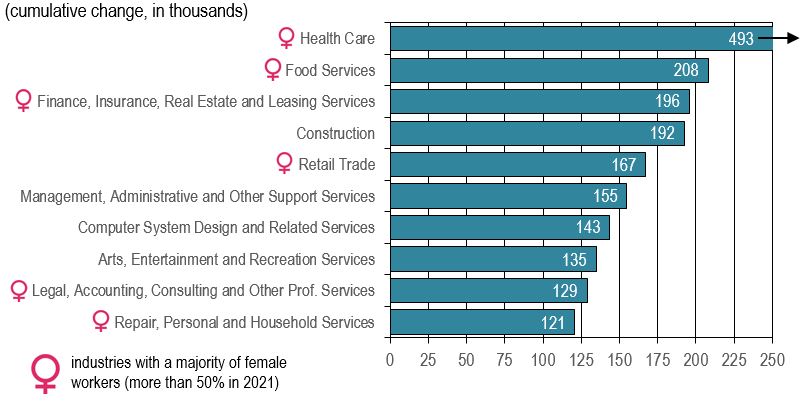
Figure 17 presents the ten industries that are projected to post the largest increases in employment (in thousands) over the period 2022-2031. It shows that ten industries account for more than two-thirds of the total increase projected in employment across Canada over the period 2022-2031.
Figure 17: Industries Projected to Post the Largest Increases in Employment, 2022-2031
Source: ESDC 2022 COPS industrial outlook.
Text version of Figure 17: Industries Projected to Post the Largest Increases in Employment, 2022-2031
Among the 42 industries covered by COPS, 10 industries account for more than two-thirds of the total increase projected in employment across Canada over the period 2022-2031.
Future changes in the level of employment by industry can be decomposed in two components:
- The rate of growth projected in employment for the industry;
- The current number of workers in the industry (i.e. the size of the industry).
This means that the ten industries projected to experience the largest increases in the number of workers are not necessarily those projected to experience the strongest growth rates in employment.
For example, the construction and retail trade industries are projected to experience among the largest increases in the number of workers, despite moderate growth rates in employment (page 27). This simply reflects the large size of these two industries relative to other industries.
Gender Analysis
- The projections cannot be performed by gender, but the historical data provide the distribution of men and women in industrial and occupational employment.
- The data show that female workers are mostly concentrated in services. This is because women are more likely than men to work in services-producing industries, while men are more likely than women to work in goods-producing industries.
- In 2021, 90% of female workers were operating in services, compared to 70% for male workers. Inversely, 30% of male workers were operating in the primary, manufacturing or construction industries, compared to 10% for female workers.
- Among the twelve industries with a majority of female workers, six industries are expected to post strong growth in employment (Figure 14), five are expected to post moderate growth in employment (Figure 15), and only one is expected to post weak growth in employment (Figure 16).
- Among the ten industries projected to experience the largest increases in the number of workers (Figure 17), six industries are dominated by female workers, as women tend to operate in services industries with a high number of workers.
| For more details on the historical and future performance of the 42 industries covered by COPS, including key drivers of GDP and employment growth, please consult the Industrial Summaries. |